 3
3peptides
spectra
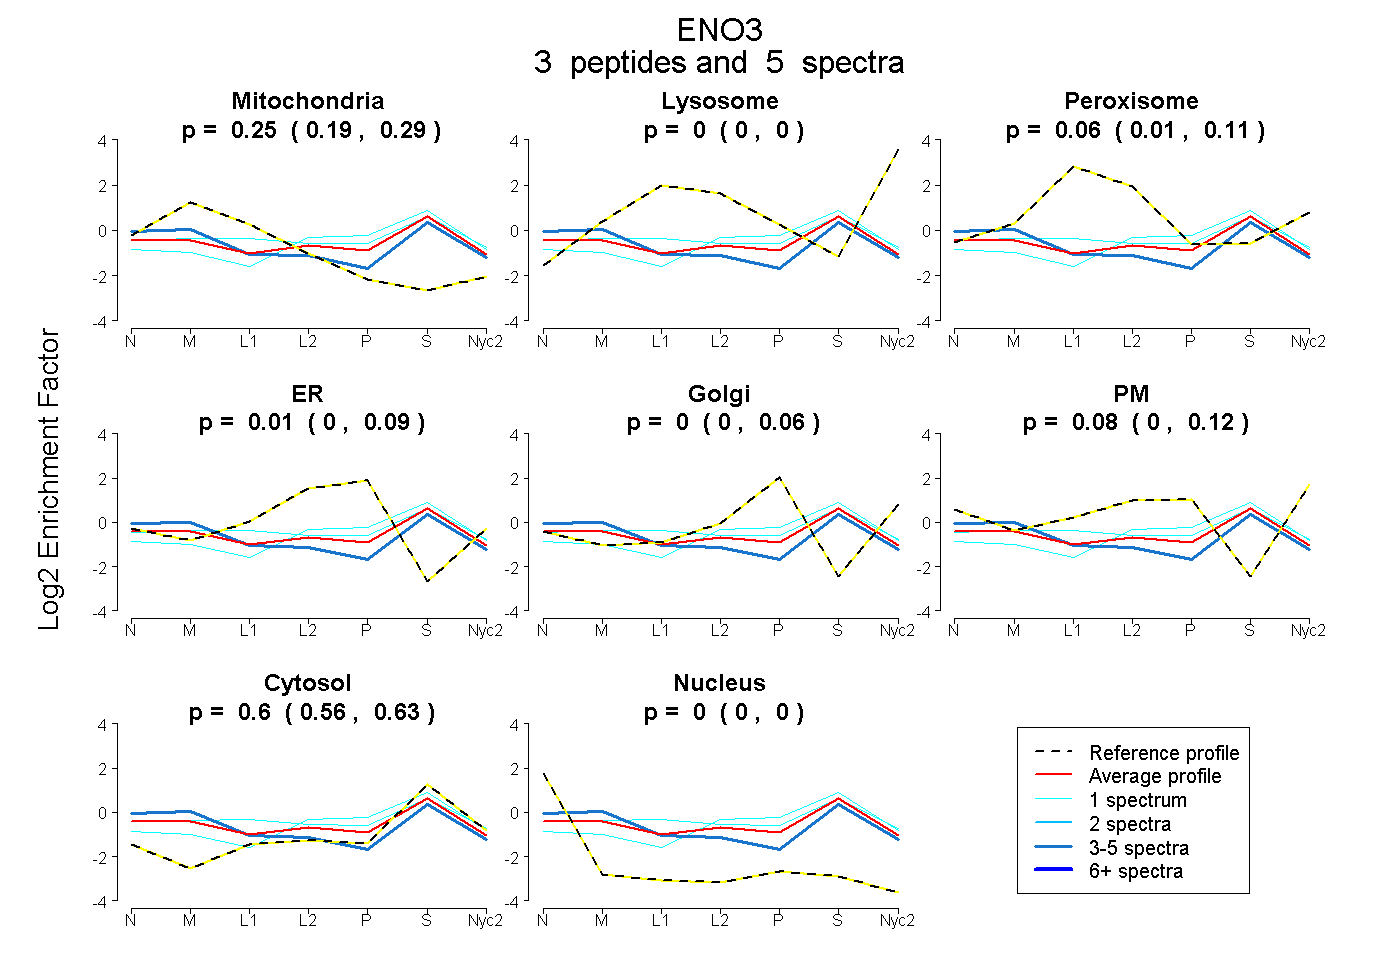
0.189 | 0.287
0.000 | 0.000
0.008 | 0.113
0.000 | 0.089
0.000 | 0.062
0.000 | 0.119
0.557 | 0.631
0.000 | 0.000
| Plot | Mito | Lyso | Perox | ER | Golgi | PM | Cytosol | Nucleus | |||||
| Expt A |
3 peptides |
5 spectra |
|
0.246 0.189 | 0.287 |
0.000 0.000 | 0.000 |
0.063 0.008 | 0.113 |
0.007 0.000 | 0.089 |
0.000 0.000 | 0.062 |
0.082 0.000 | 0.119 |
0.602 0.557 | 0.631 |
0.000 0.000 | 0.000 |
| 1 spectrum, AVFAGR | 0.176 | 0.000 | 0.222 | 0.000 | 0.079 | 0.000 | 0.522 | 0.000 | ||
| 3 spectra, IEEALGDK | 0.436 | 0.000 | 0.011 | 0.000 | 0.000 | 0.008 | 0.545 | 0.000 | ||
| 1 spectrum, ACNCLLLK | 0.033 | 0.000 | 0.003 | 0.240 | 0.000 | 0.009 | 0.715 | 0.000 |
| Plot | Lyso | Other | |||||||||||
| Expt C |
1 peptide |
3 spectra |
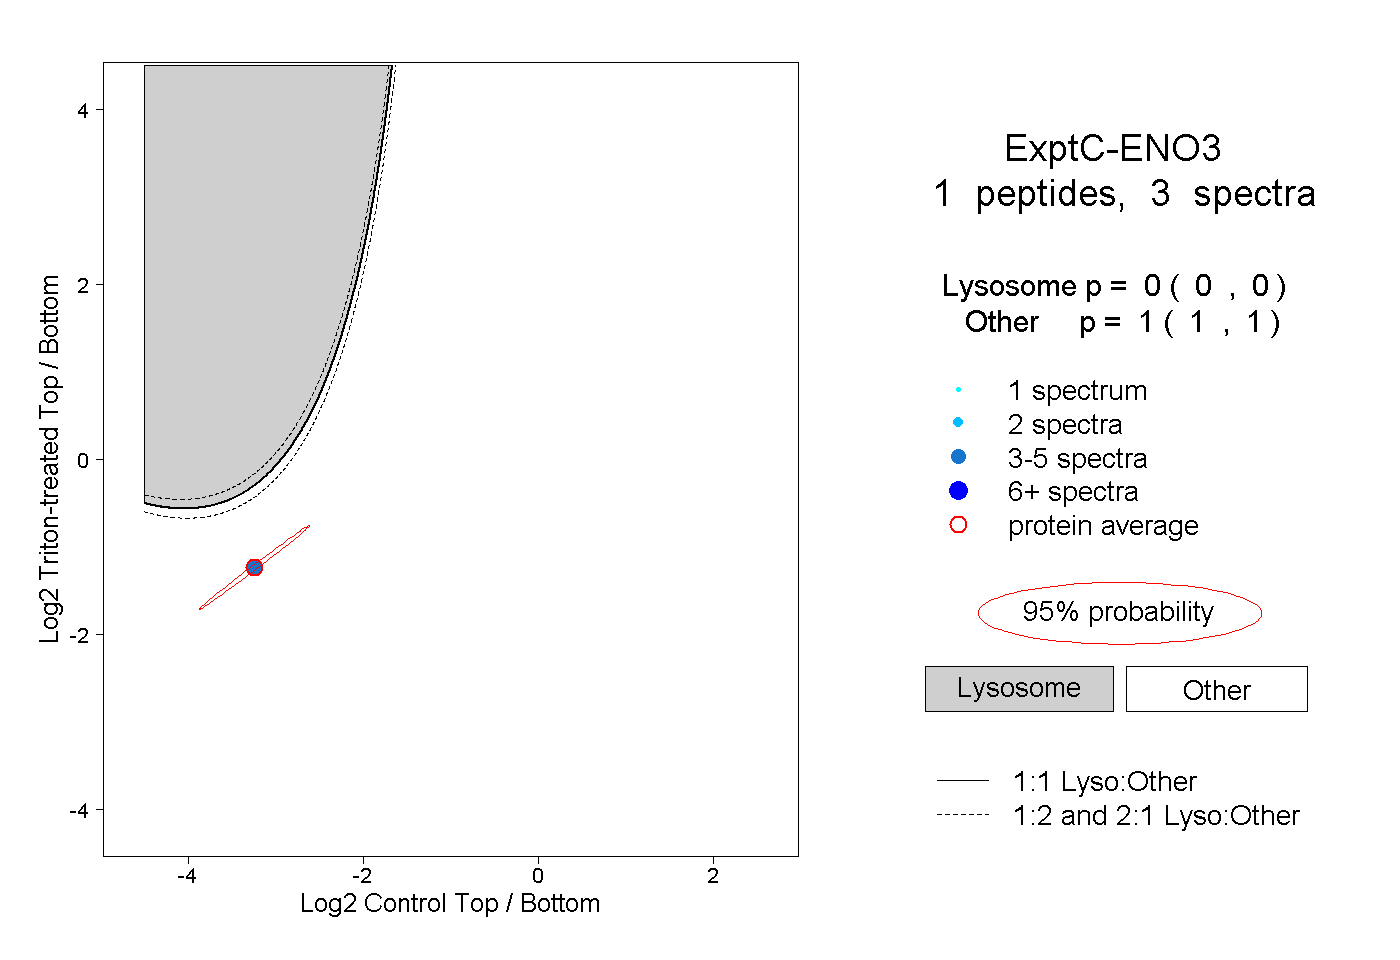 |
0.000 0.000 | 0.000 |
1.000 1.000 | 1.000 |
||||||||
| Plot | Lyso | Other | |||||||||||
| Expt D |
1 peptide |
1 spectrum |
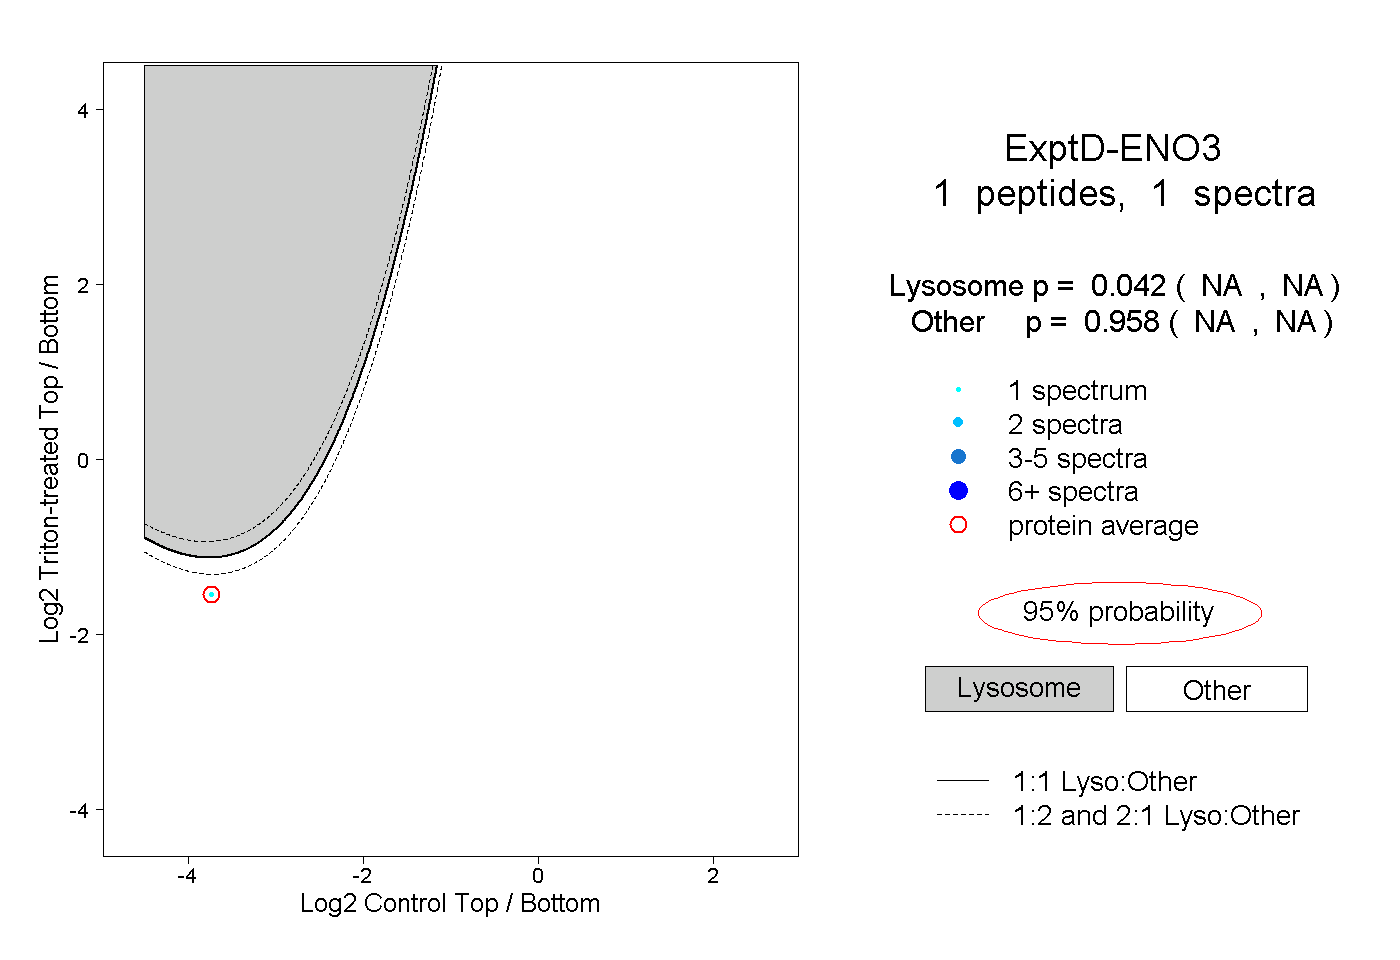 |
0.042 NA | NA |
0.958 NA | NA |