 7
7peptides
spectra
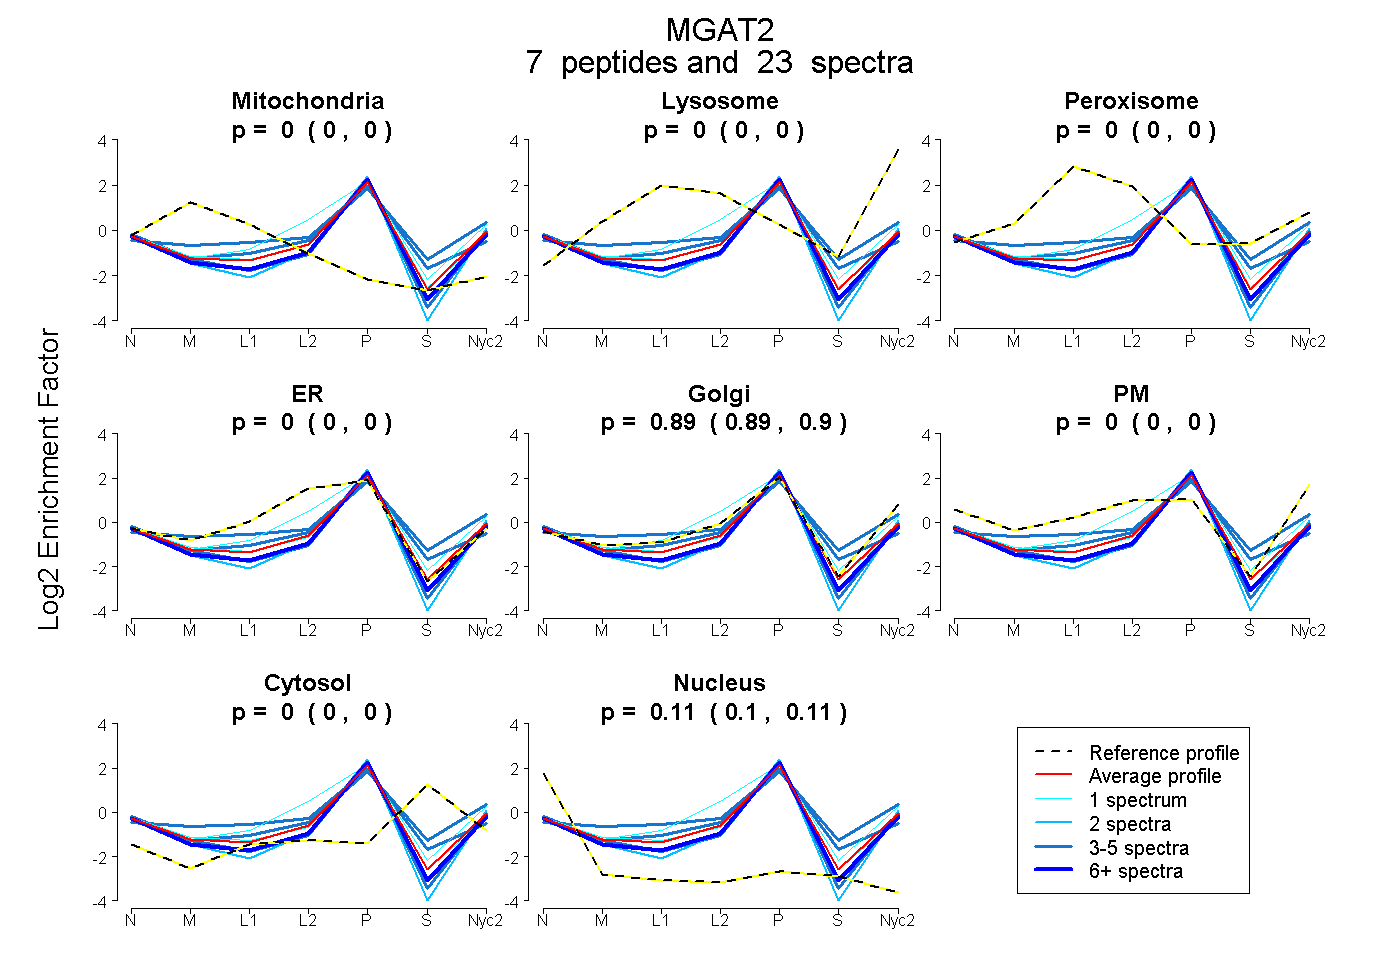
0.000 | 0.000
0.000 | 0.000
0.000 | 0.000
0.000 | 0.000
0.888 | 0.900
0.000 | 0.000
0.000 | 0.000
0.100 | 0.111
2peptides
spectra
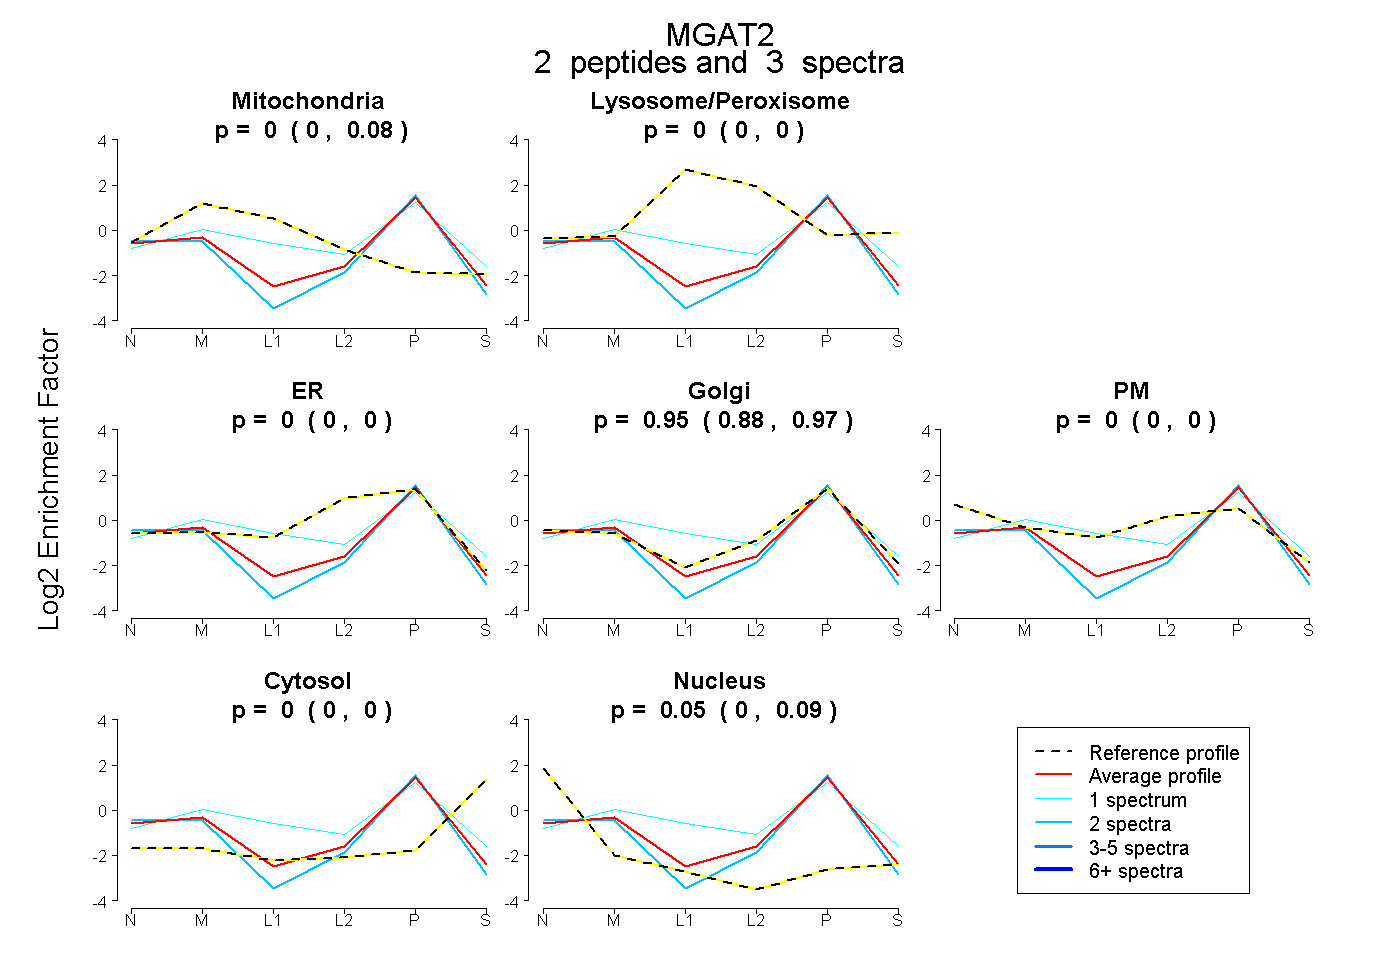
0.000 | 0.080
0.000 | 0.000
0.000 | 0.000
0.880 | 0.971
0.000 | 0.000
0.000 | 0.000
0.000 | 0.086
2peptides
spectra
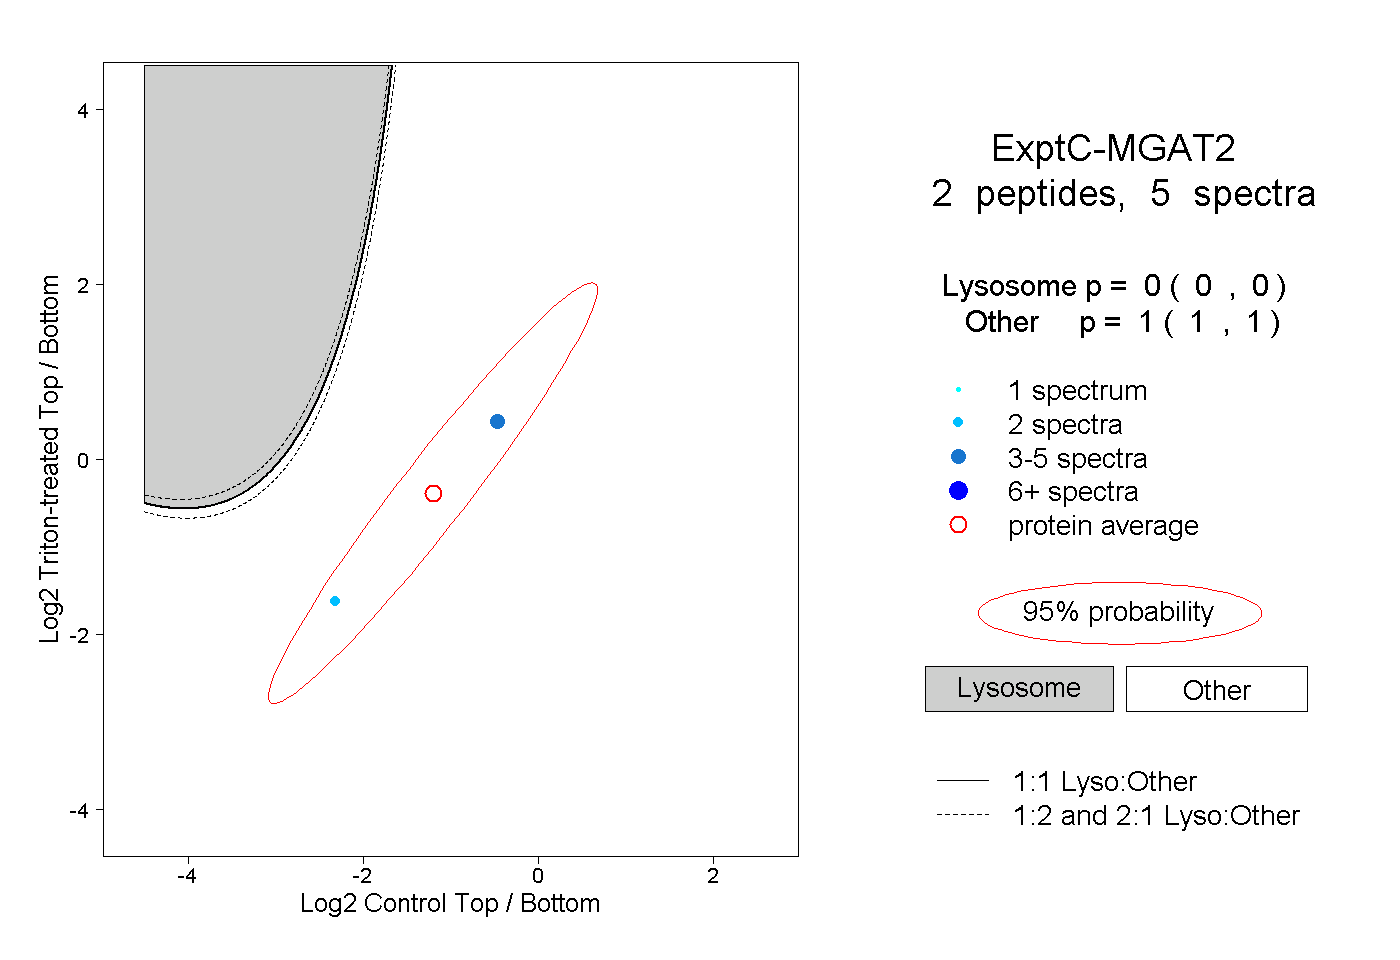
0.000 | 0.000
1.000 | 1.000
1peptide
spectrum
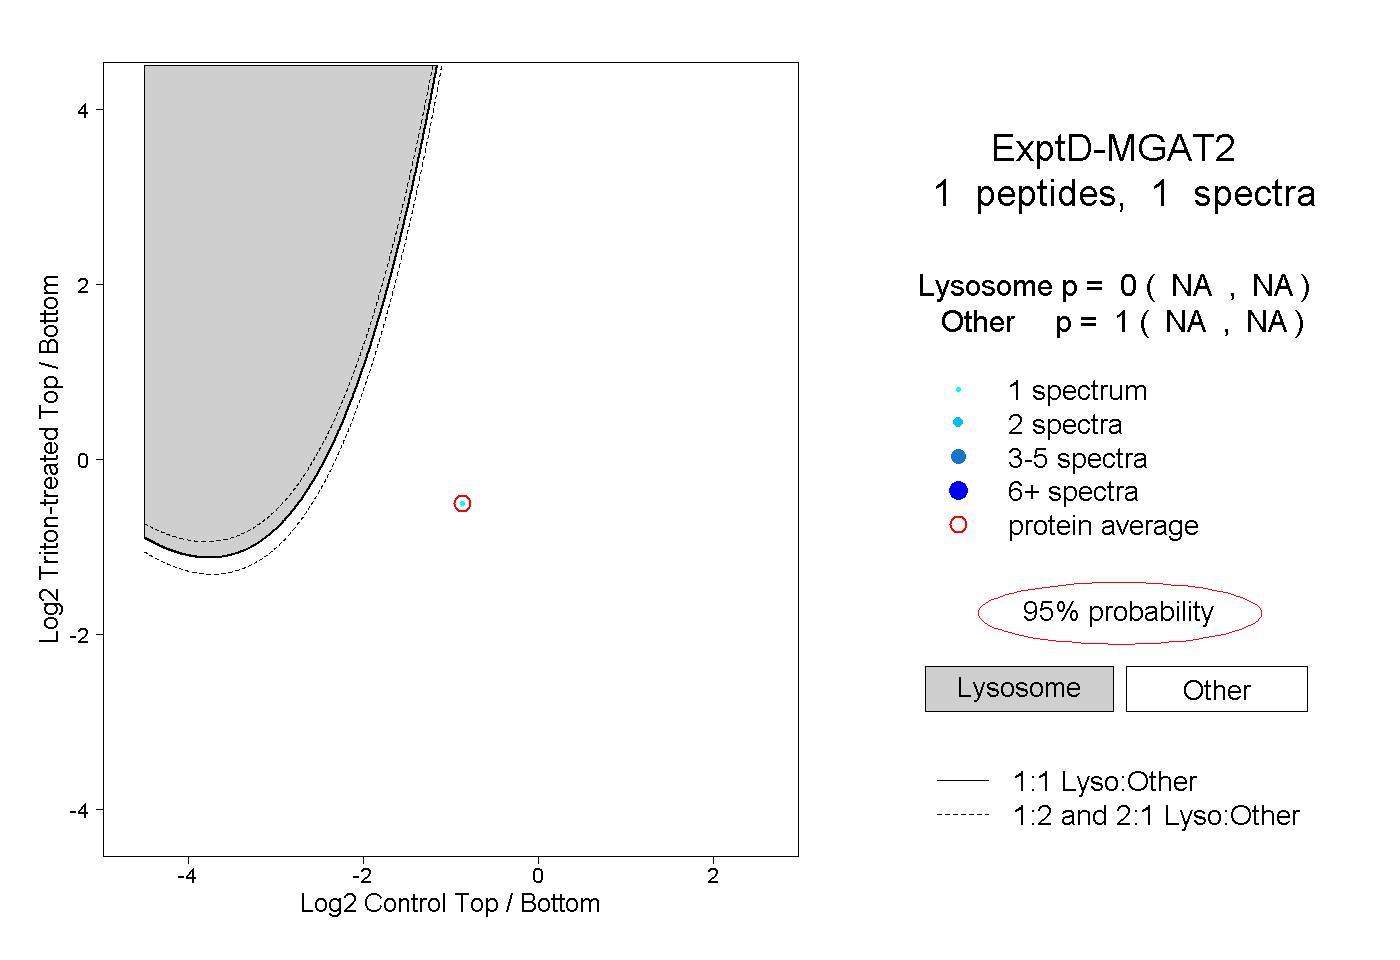
NA | NA
NA | NA