 7
7peptides
spectra
0.000 | 0.000
0.000 | 0.000
0.000 | 0.000
0.000 | 0.000
0.888 | 0.900
0.000 | 0.000
0.000 | 0.000
0.100 | 0.111
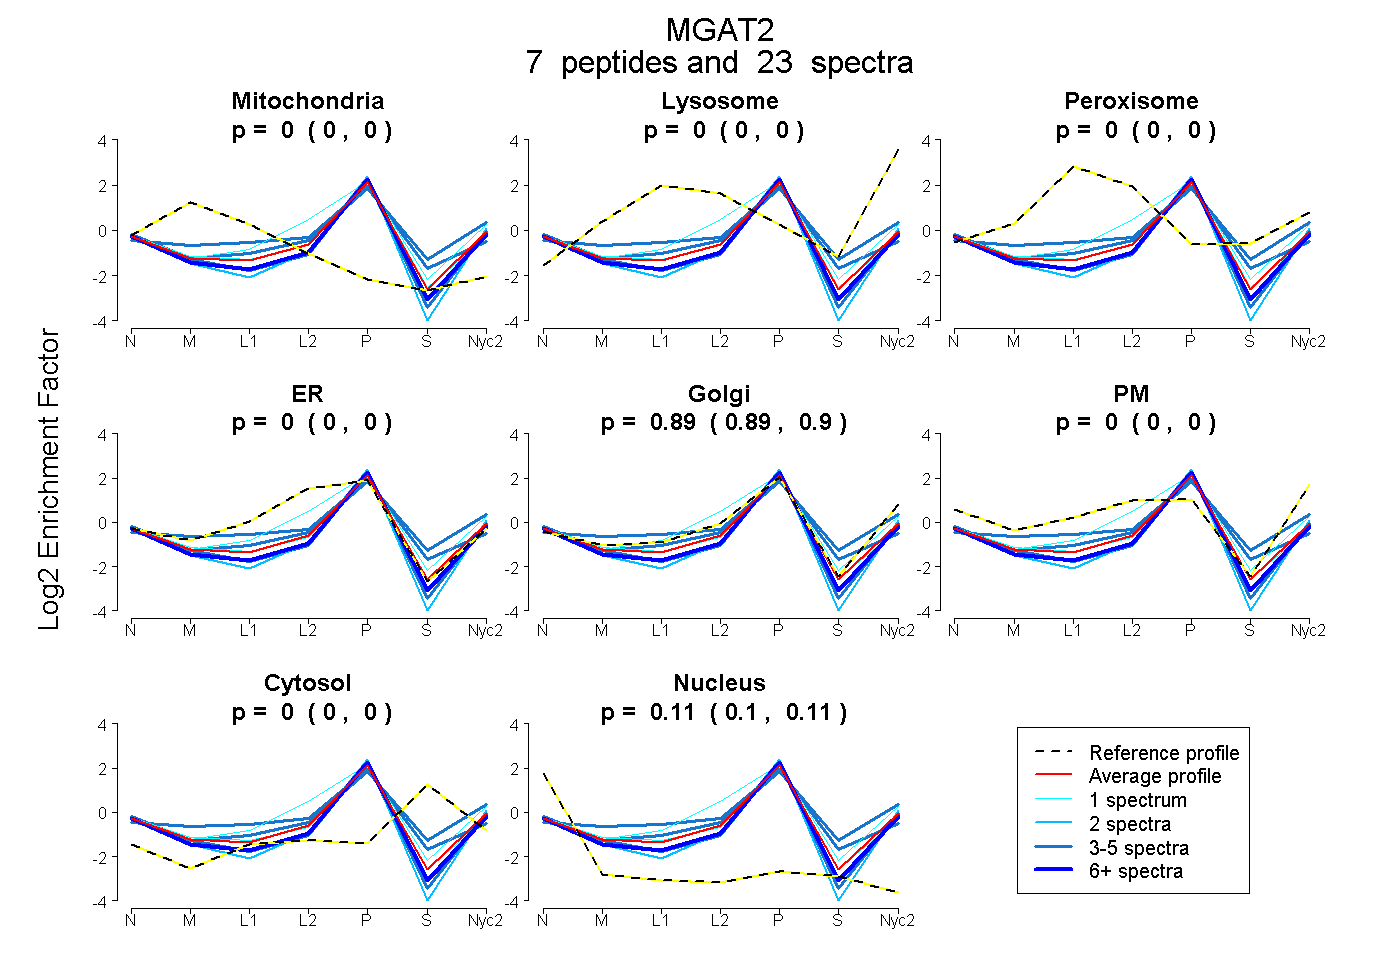
| Plot | Mito | Lyso | Perox | ER | Golgi | PM | Cytosol | Nucleus | |||||
| Expt A |
7 peptides |
23 spectra |
|
0.000 0.000 | 0.000 |
0.000 0.000 | 0.000 |
0.000 0.000 | 0.000 |
0.000 0.000 | 0.000 |
0.894 0.888 | 0.900 |
0.000 0.000 | 0.000 |
0.000 0.000 | 0.000 |
0.106 0.100 | 0.111 |
| 8 spectra, VLVPQAPR | 0.000 | 0.000 | 0.000 | 0.000 | 0.854 | 0.000 | 0.000 | 0.146 | ||
| 4 spectra, LHFVWER | 0.000 | 0.000 | 0.000 | 0.000 | 0.859 | 0.000 | 0.000 | 0.141 | ||
| 1 spectrum, QYLFPETLVIGEK | 0.000 | 0.000 | 0.000 | 0.462 | 0.476 | 0.000 | 0.000 | 0.062 | ||
| 2 spectra, LLIDSLR | 0.000 | 0.000 | 0.000 | 0.000 | 0.865 | 0.000 | 0.000 | 0.135 | ||
| 3 spectra, IFHAGDCGMHHK | 0.080 | 0.000 | 0.000 | 0.243 | 0.558 | 0.000 | 0.119 | 0.000 | ||
| 4 spectra, FPMAAISPPR | 0.000 | 0.000 | 0.000 | 0.000 | 0.809 | 0.000 | 0.191 | 0.000 | ||
| 1 spectrum, NDALAPPLLDSEPLR | 0.000 | 0.000 | 0.000 | 0.000 | 0.910 | 0.000 | 0.012 | 0.078 |
| Plot | Mito | Lyso or Perox | ER | Golgi | PM | Cytosol | Nucleus | ||||||
| Expt B |
2 peptides |
3 spectra |
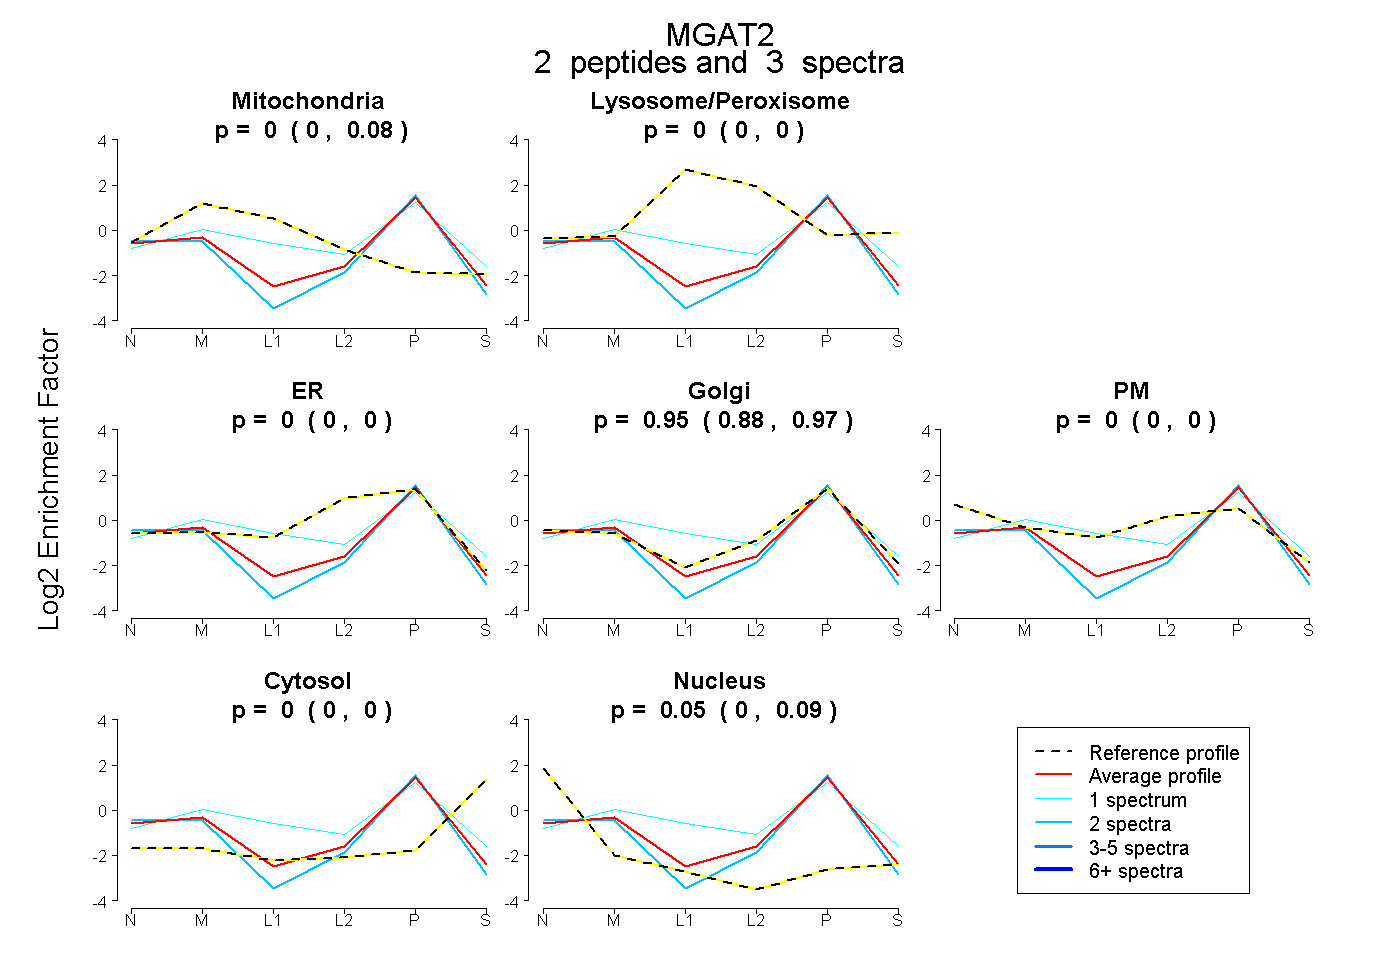 |
0.000 0.000 | 0.080 |
0.000 0.000 | 0.000 |
0.000 0.000 | 0.000 |
0.949 0.880 | 0.971 |
0.000 0.000 | 0.000 |
0.000 0.000 | 0.000 |
0.051 0.000 | 0.086 |
|||
| Plot | Lyso | Other | |||||||||||
| Expt C |
2 peptides |
5 spectra |
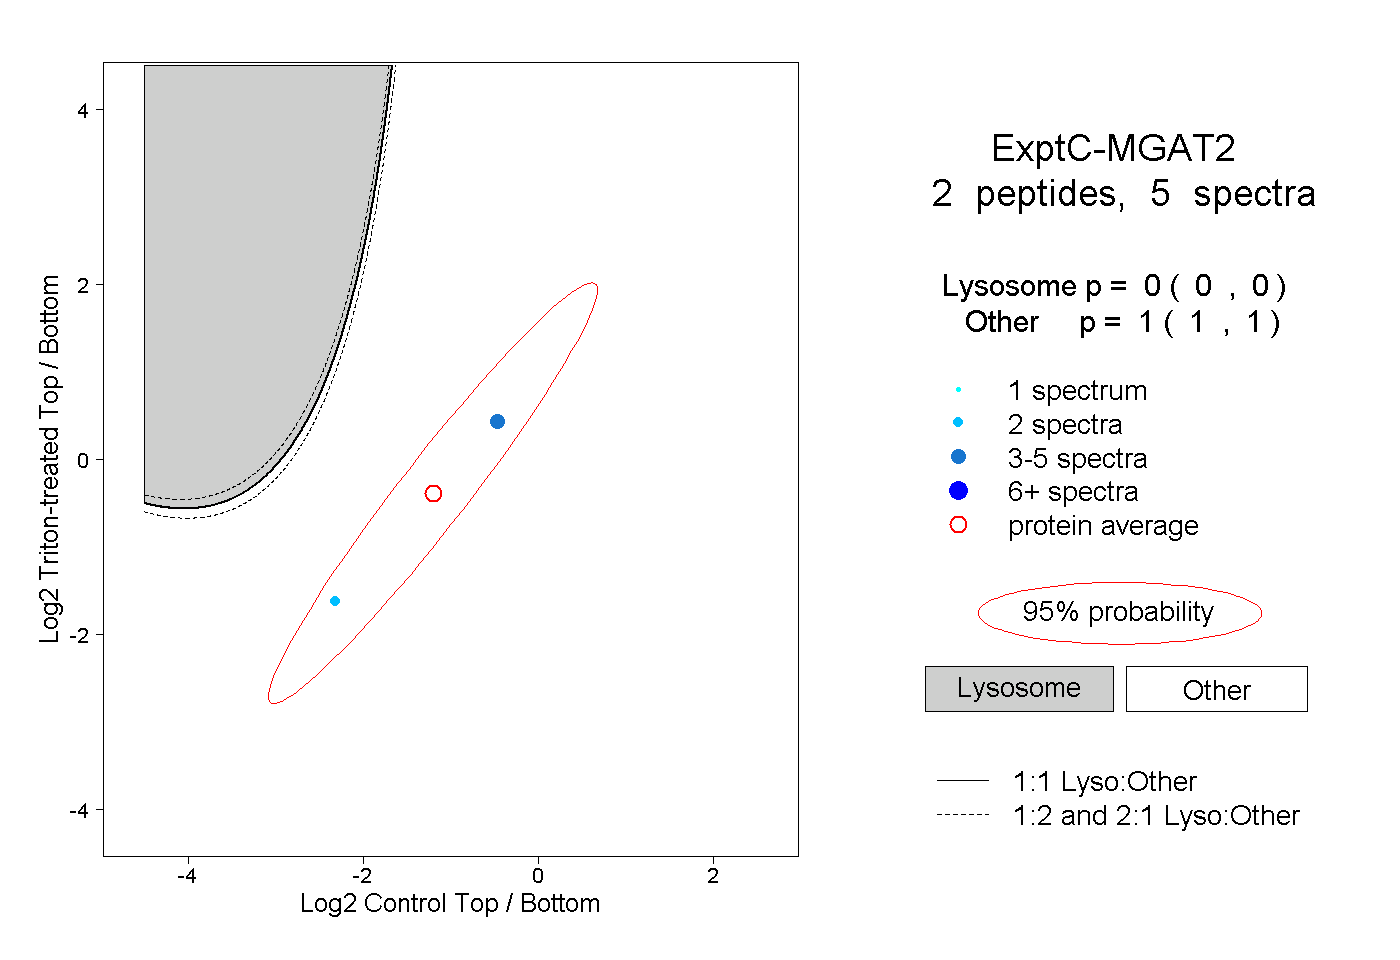 |
0.000 0.000 | 0.000 |
1.000 1.000 | 1.000 |
||||||||
| Plot | Lyso | Other | |||||||||||
| Expt D |
1 peptide |
1 spectrum |
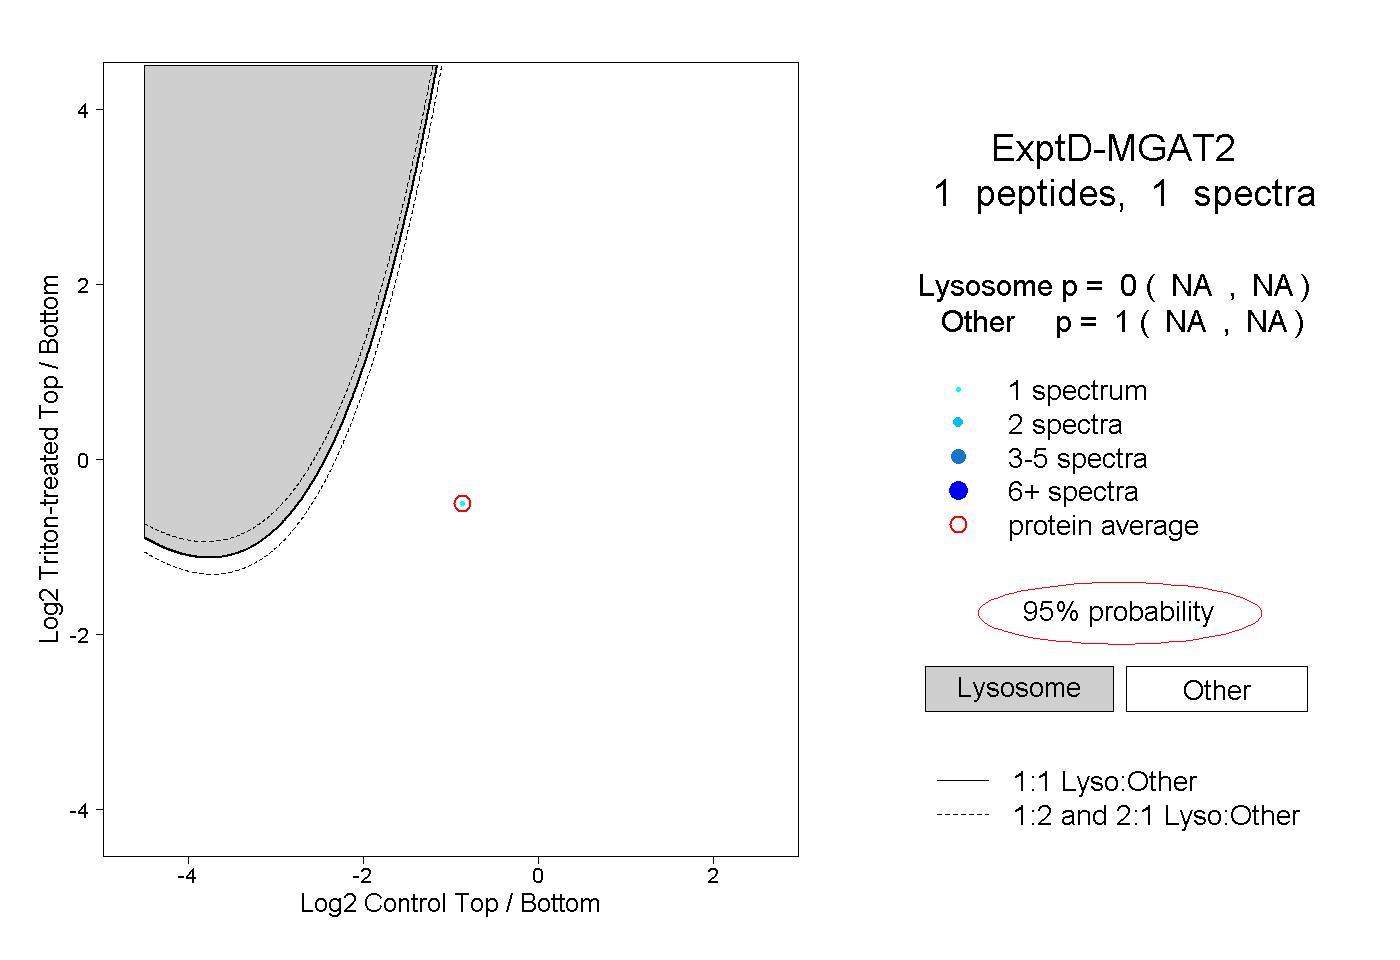 |
0.000 NA | NA |
1.000 NA | NA |