 14
14peptides
spectra
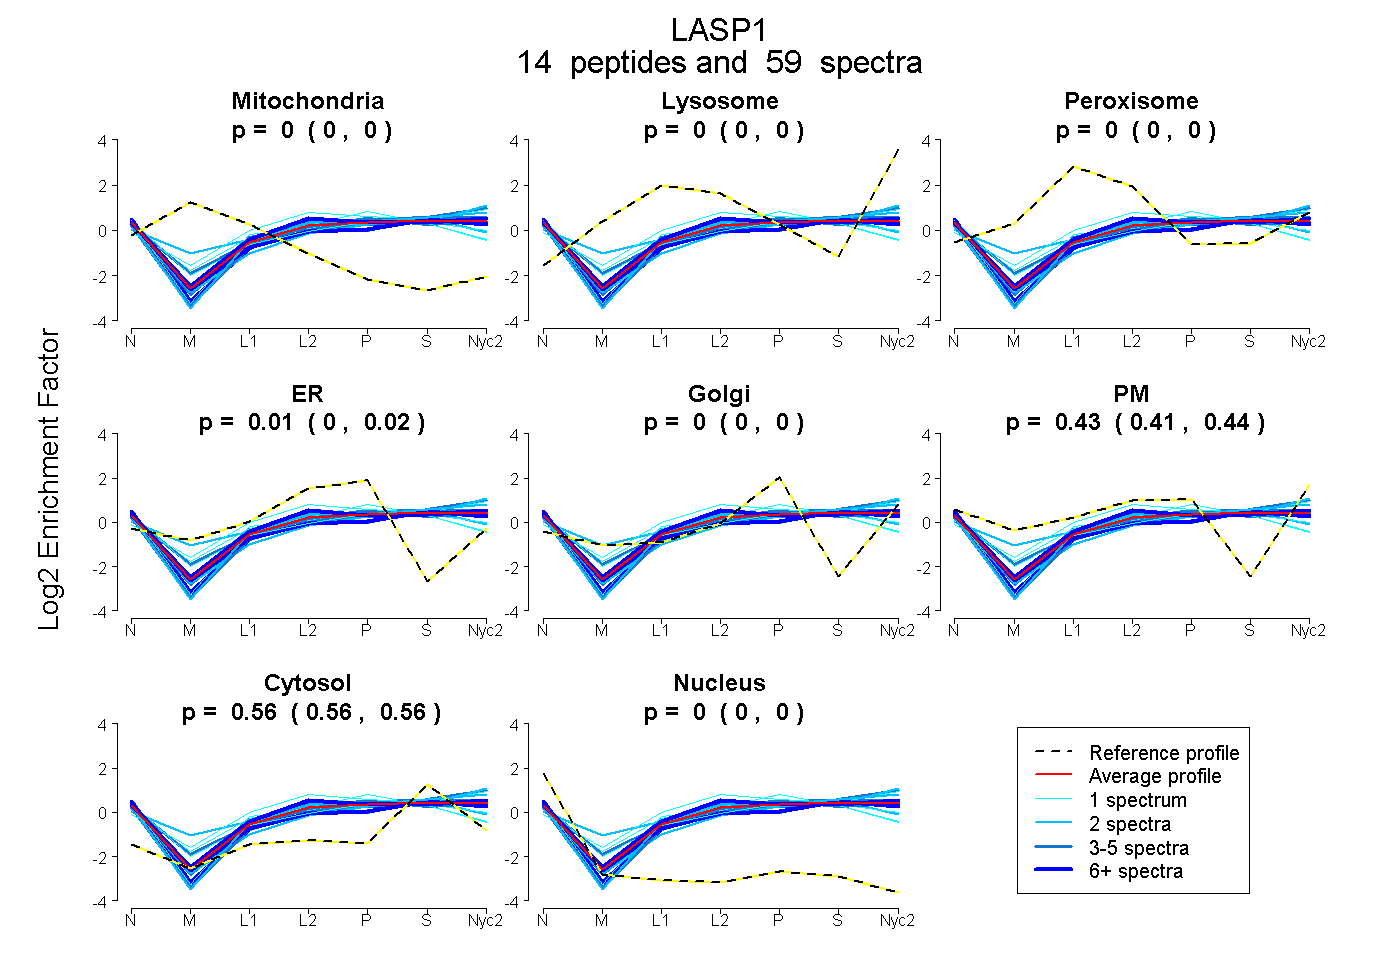
0.000 | 0.000
0.000 | 0.000
0.000 | 0.000
0.002 | 0.022
0.000 | 0.000
0.414 | 0.436
0.557 | 0.563
0.000 | 0.000
6peptides
spectra
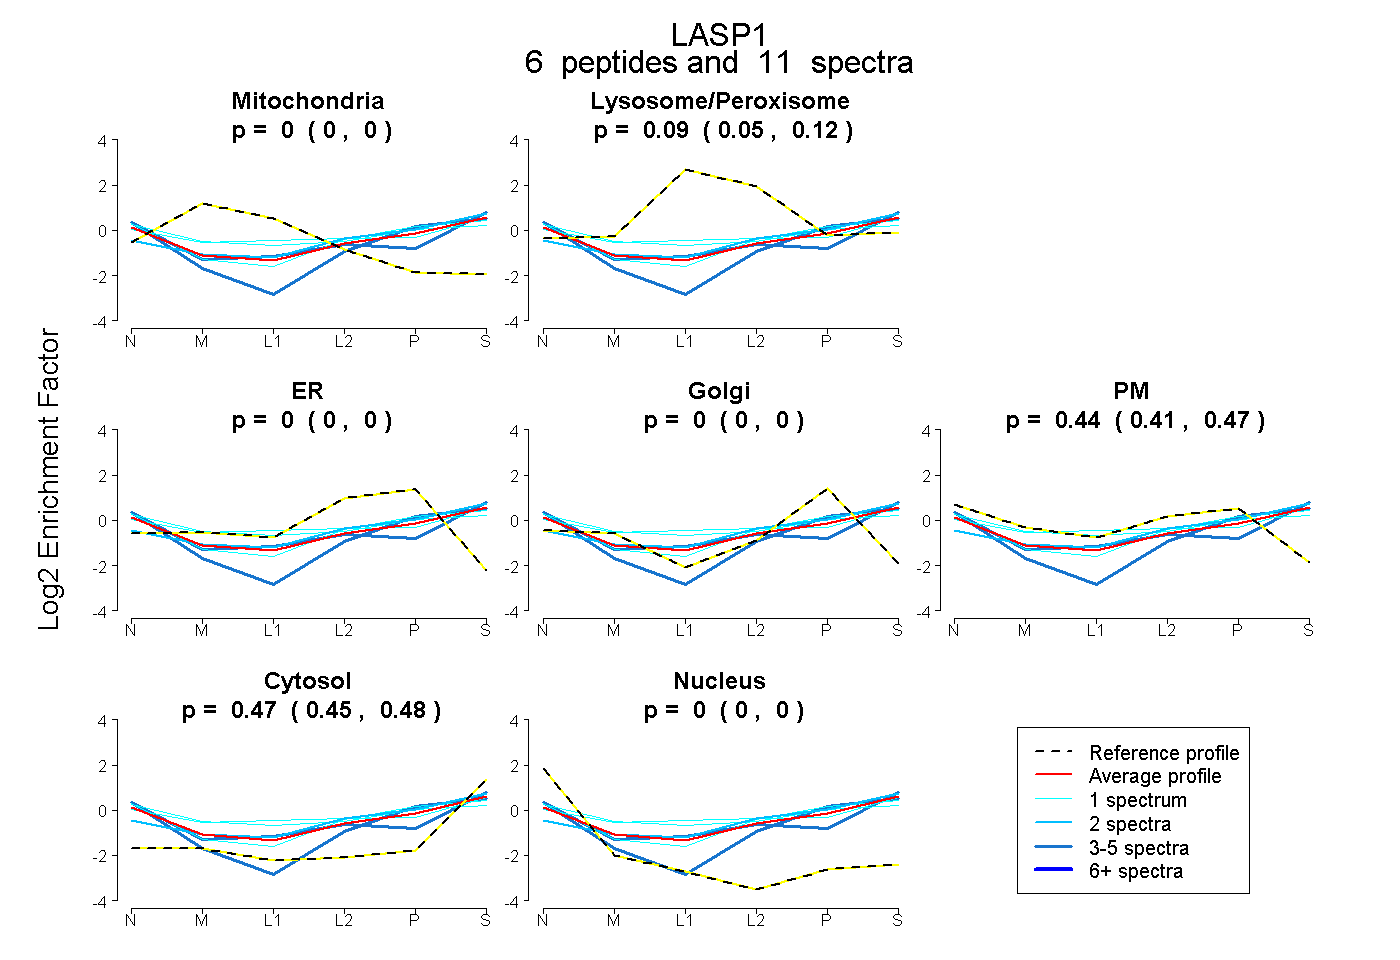
0.000 | 0.000
0.047 | 0.116
0.000 | 0.000
0.000 | 0.000
0.413 | 0.470
0.453 | 0.485
0.000 | 0.000
13peptides
spectra
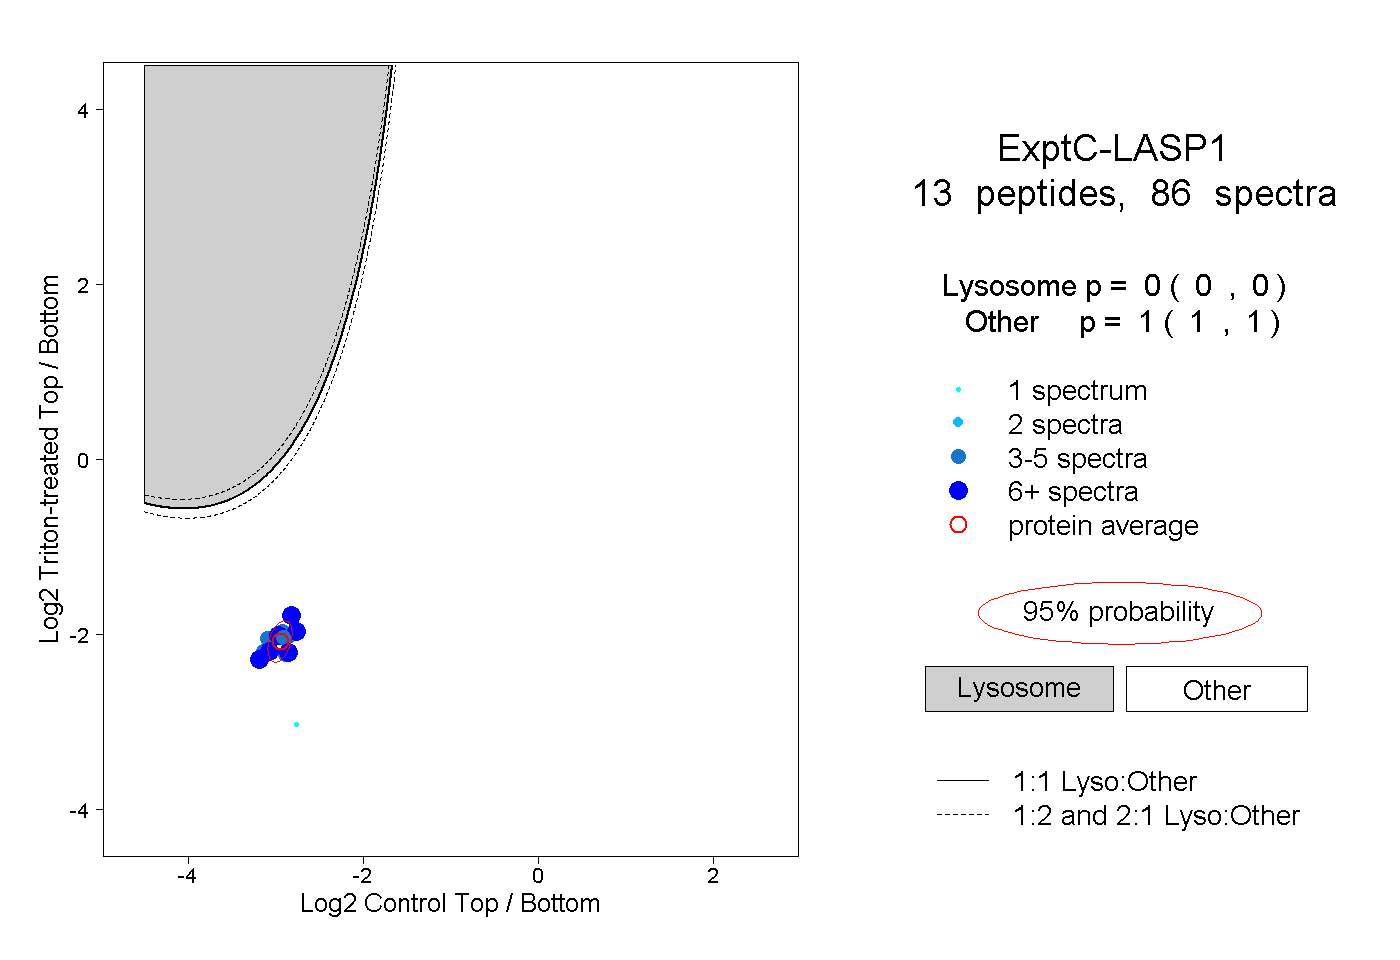
0.000 | 0.000
1.000 | 1.000
6peptides
spectra

0.000 | 0.000
1.000 | 1.000