LASP1
[ENSRNOP00000005522]
Main page
| | | Plot |
Mito |
Lyso |
|
Perox |
ER |
Golgi |
PM |
Cytosol |
Nucleus |
|
| Expt A |
 14
14
peptides |
59
spectra |
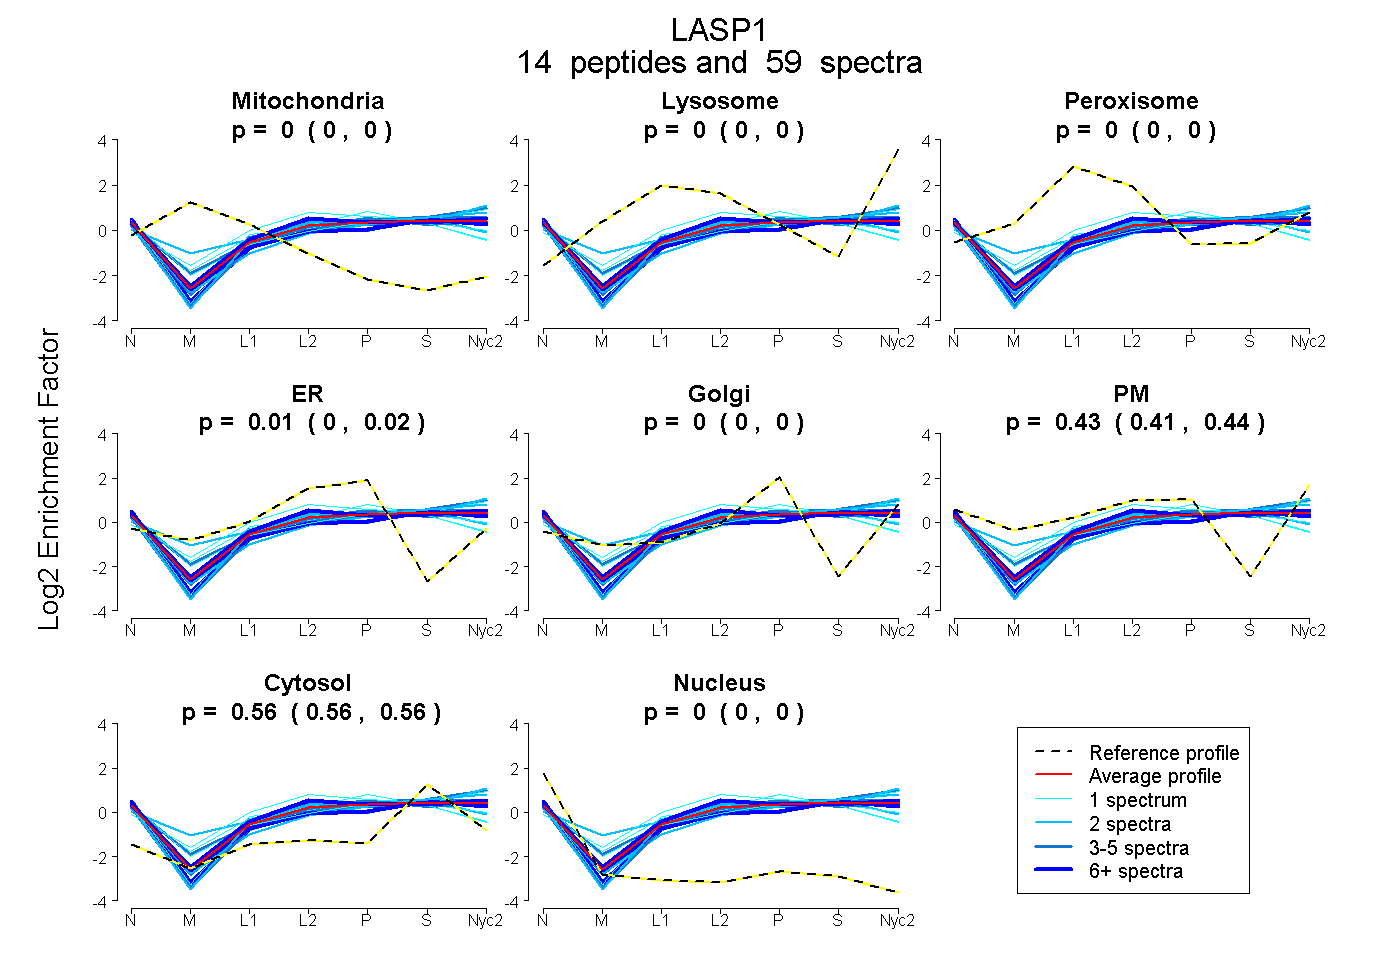 |
0.000
0.000 | 0.000 |
0.000
0.000 | 0.000 |
|
0.000
0.000 | 0.000 |
0.014
0.002 | 0.022 |
0.000
0.000 | 0.000 |
0.426
0.414 | 0.436 |
0.560
0.557 | 0.563 |
0.000
0.000 | 0.000 |
|
| | | Plot |
Mito |
|
Lyso or Perox |
|
ER |
Golgi |
PM |
Cytosol |
Nucleus |
|
| Expt B |
6
peptides |
11
spectra |
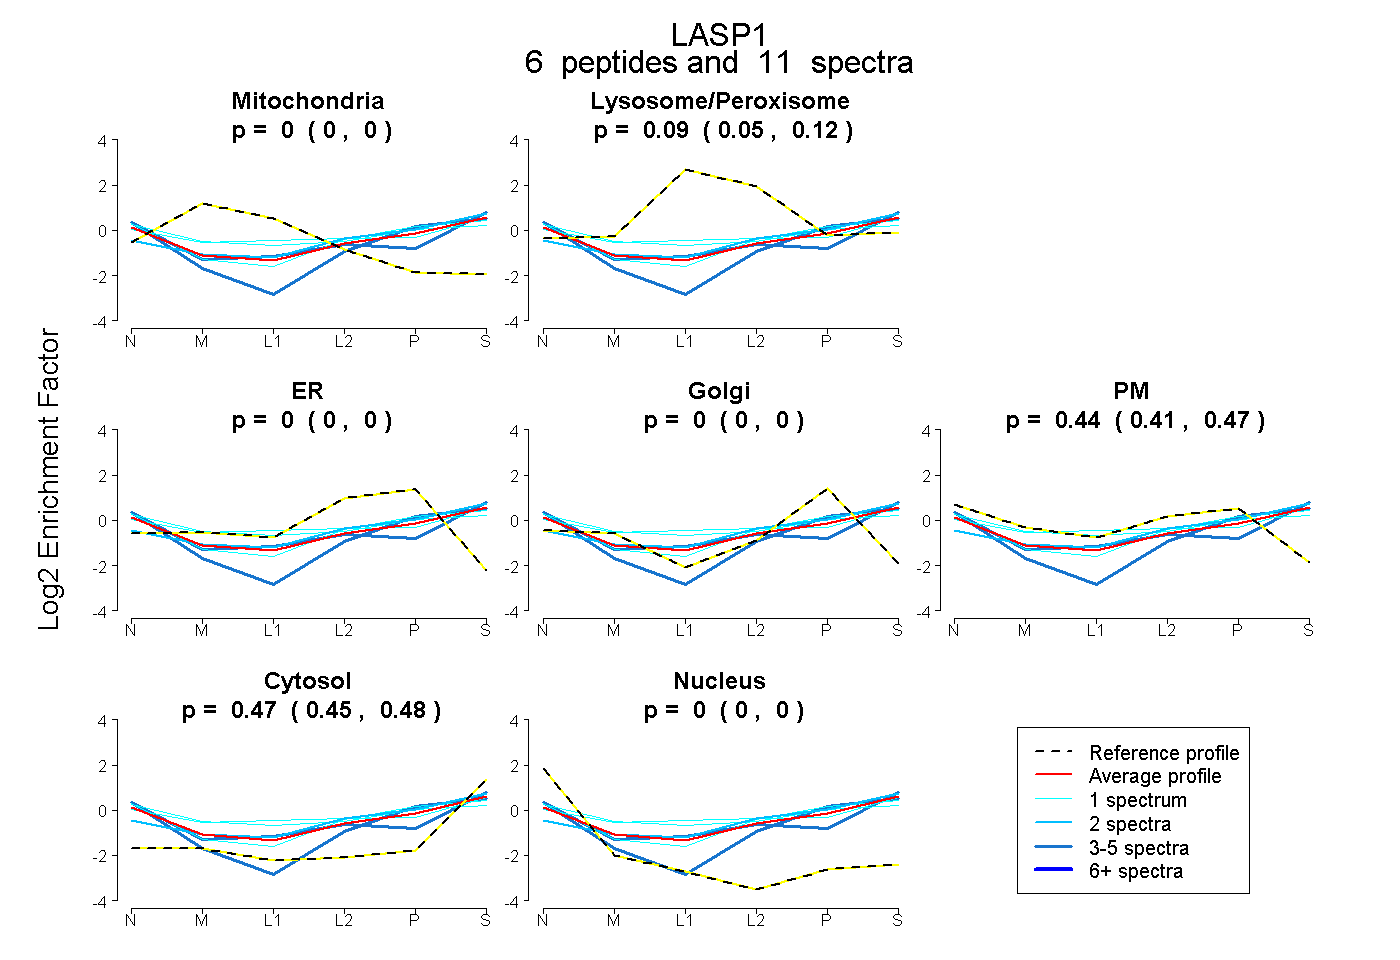 |
0.000
0.000 | 0.000 |
|
0.086
0.047 | 0.116 |
|
0.000
0.000 | 0.000 |
0.000
0.000 | 0.000 |
0.445
0.413 | 0.470 |
0.470
0.453 | 0.485 |
0.000
0.000 | 0.000 |
|
| 1 spectrum, EPAAPVSIQR |
0.000 |
|
0.028 |
|
0.000 |
0.000 |
0.544 |
0.428 |
0.000 |
|
| 3 spectra, EAQDSSSYR |
0.000 |
|
0.000 |
|
0.000 |
0.332 |
0.156 |
0.472 |
0.039 |
|
| 1 spectrum, QQSELQSQVR |
0.000 |
|
0.275 |
|
0.000 |
0.000 |
0.325 |
0.399 |
0.000 |
|
| 1 spectrum, TQDQISNIK |
0.000 |
|
0.168 |
|
0.000 |
0.000 |
0.489 |
0.343 |
0.000 |
|
| 2 spectra, YHEEFEK |
0.000 |
|
0.230 |
|
0.000 |
0.220 |
0.096 |
0.454 |
0.000 |
|
| 3 spectra, ACFHCETCK |
0.000 |
|
0.199 |
|
0.000 |
0.000 |
0.236 |
0.480 |
0.085 |
|
| | | Plot |
|
Lyso |
|
|
|
|
|
|
|
Other |
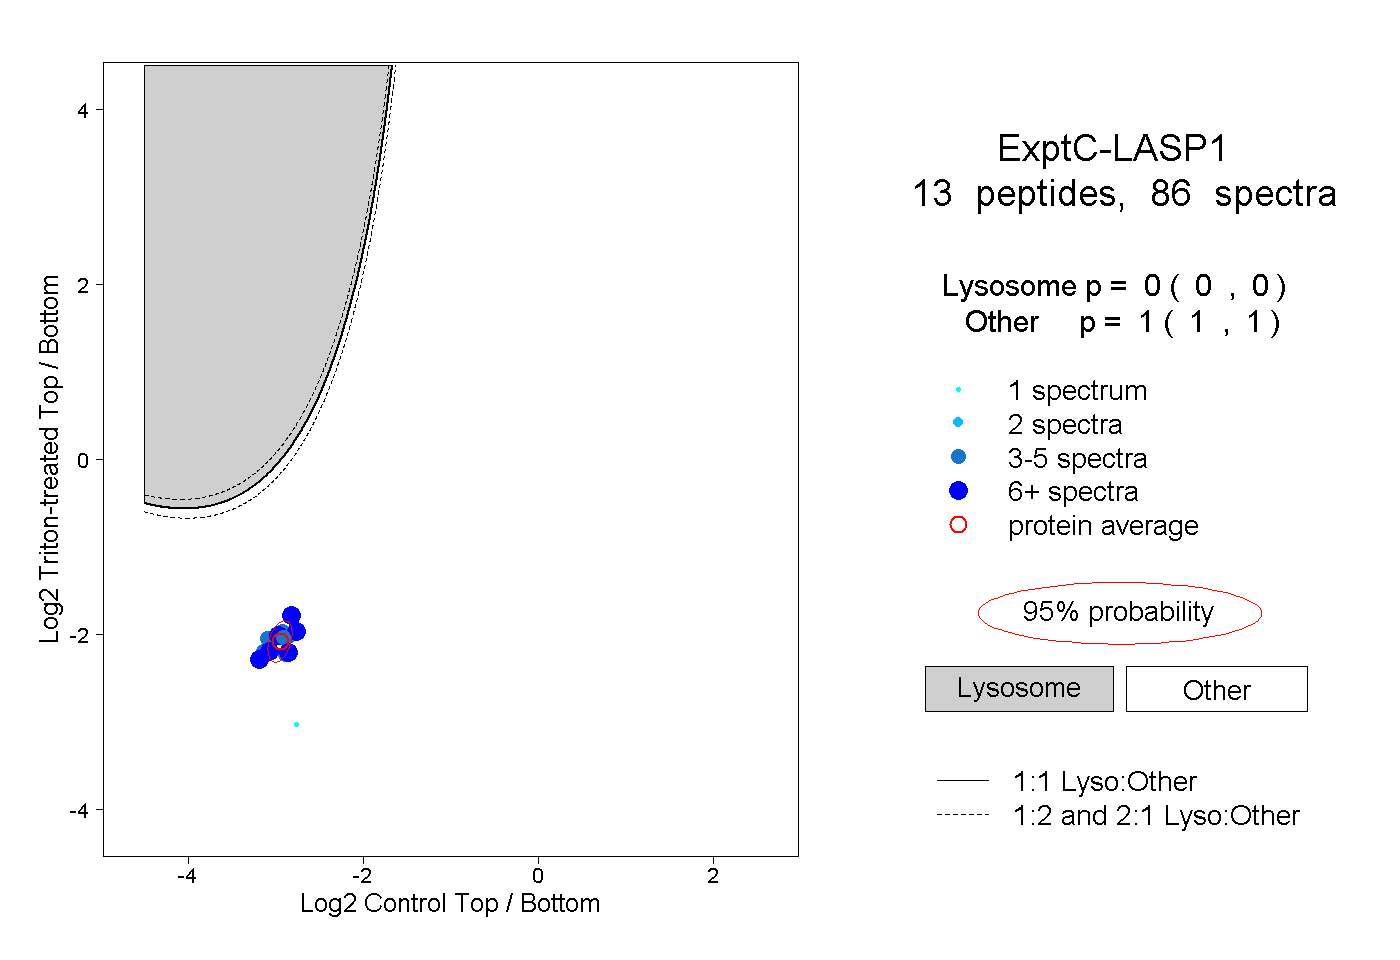
| Expt C |
13
peptides |
86
spectra |
 |
|
0.000
0.000 | 0.000 |
|
|
|
|
|
|
|
1.000
1.000 | 1.000 |
| | | Plot |
|
Lyso |
|
|
|
|
|
|
|
Other |
| Expt D |
6
peptides |
10
spectra |
 |
|
0.000
0.000 | 0.000 |
|
|
|
|
|
|
|
1.000
1.000 | 1.000 |