 8
8peptides
spectra
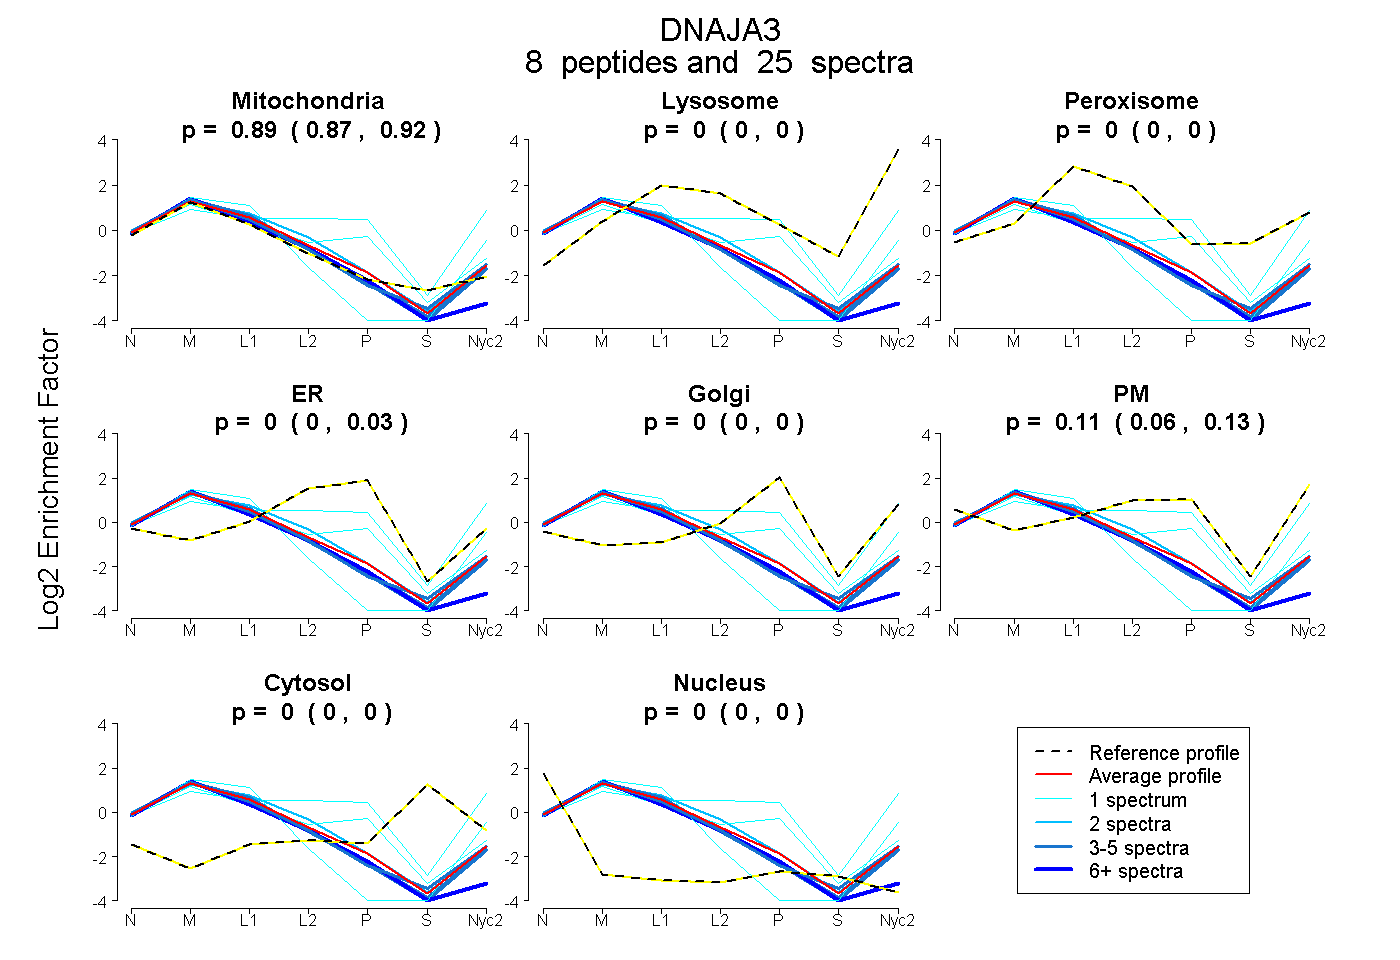
0.865 | 0.915
0.000 | 0.000
0.000 | 0.000
0.000 | 0.031
0.000 | 0.000
0.060 | 0.129
0.000 | 0.000
0.000 | 0.000
4peptides
spectra
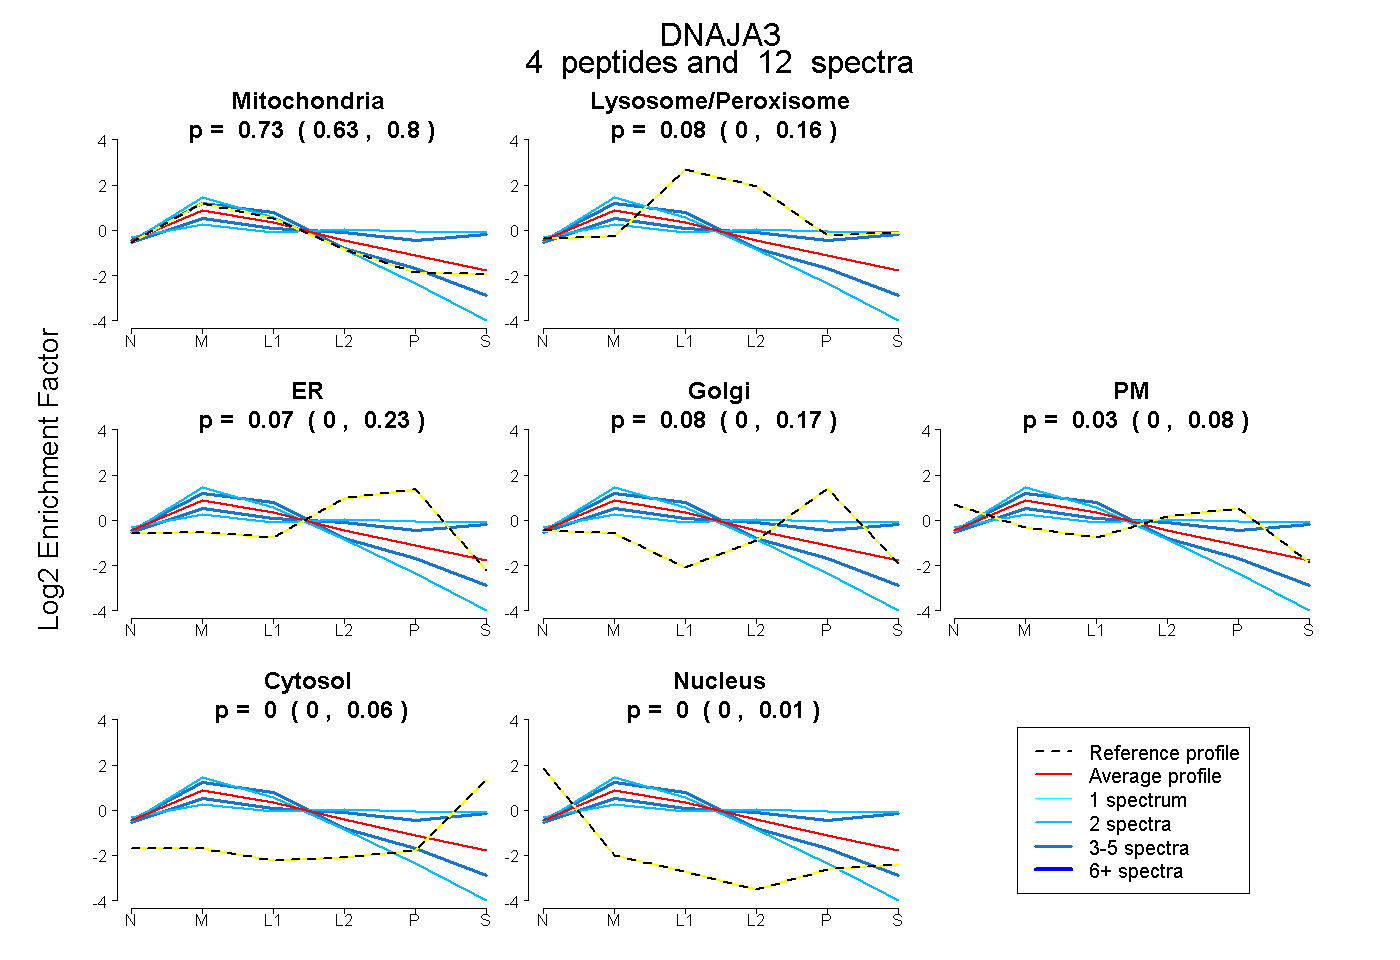
0.631 | 0.799
0.000 | 0.161
0.000 | 0.225
0.000 | 0.173
0.000 | 0.078
0.000 | 0.057
0.000 | 0.007
11peptides
spectra
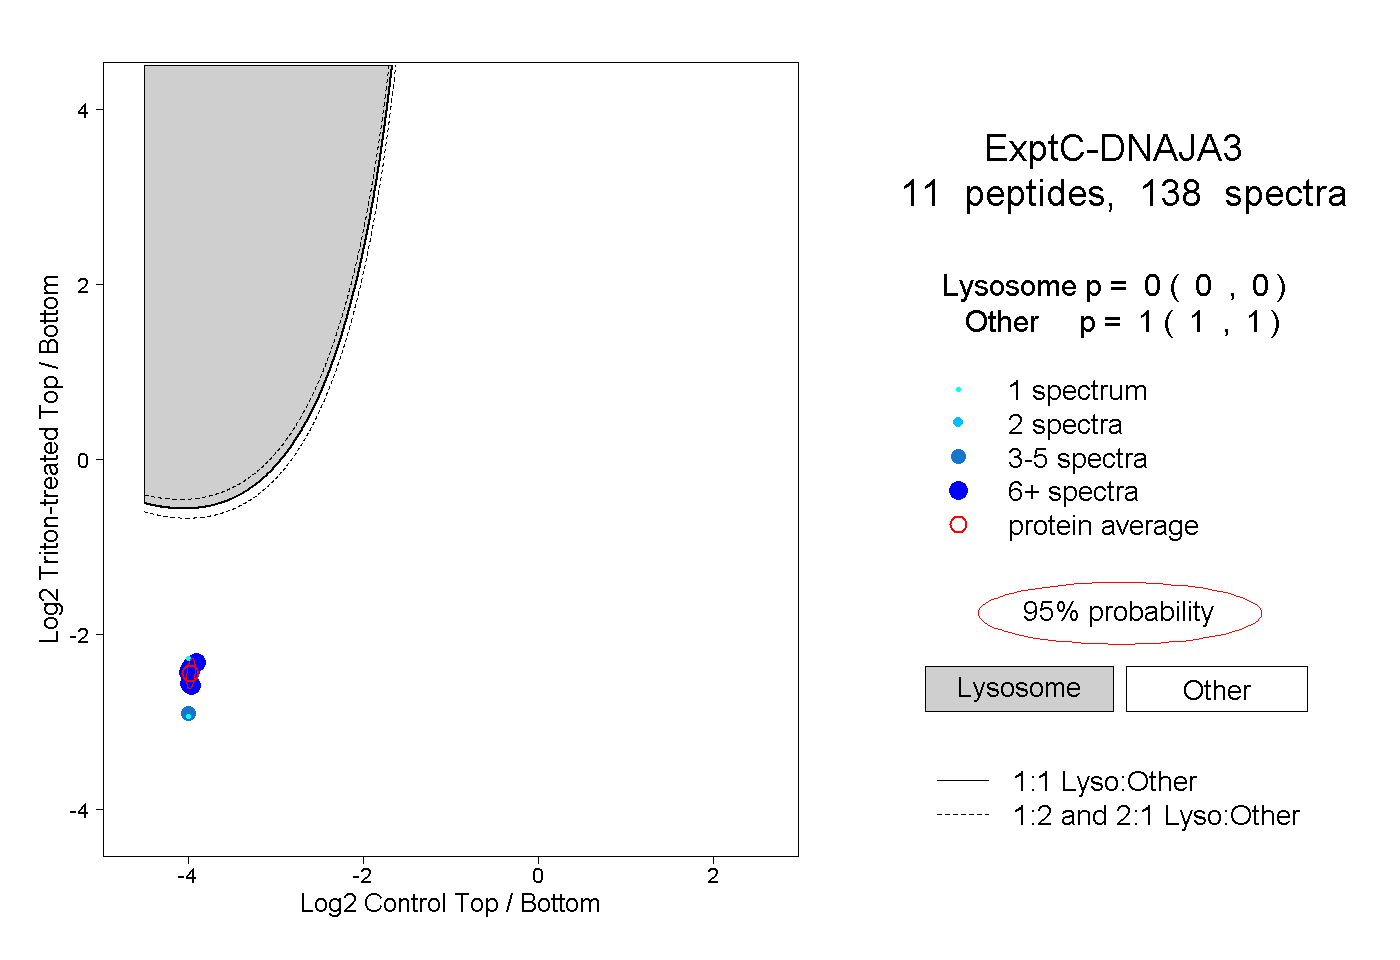
0.000 | 0.000
1.000 | 1.000
7peptides
spectra
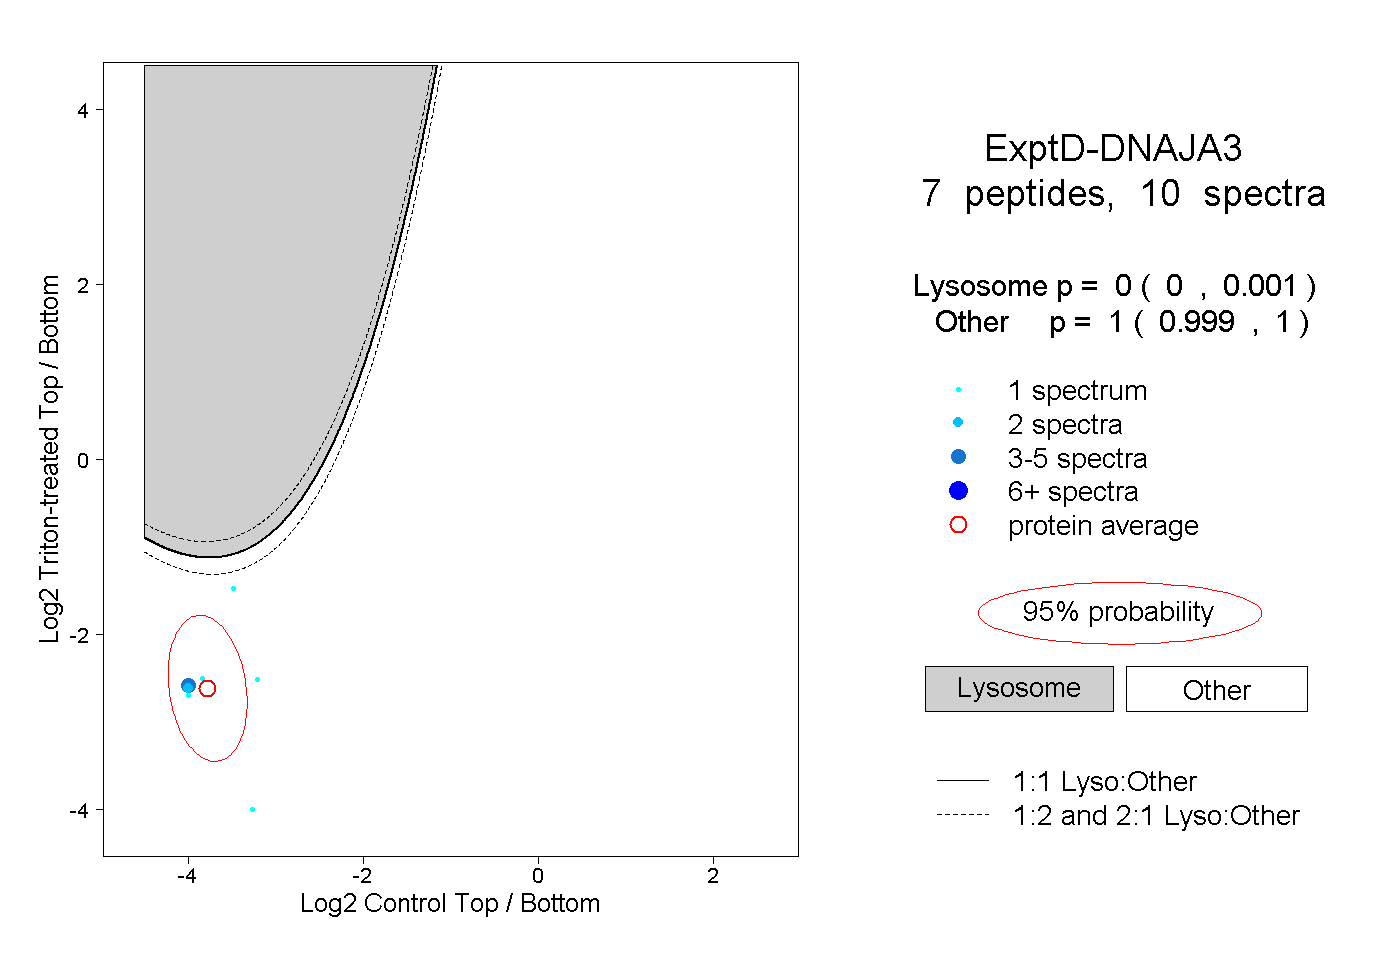
0.000 | 0.001
0.999 | 1.000