 8
8peptides
spectra
0.865 | 0.915
0.000 | 0.000
0.000 | 0.000
0.000 | 0.031
0.000 | 0.000
0.060 | 0.129
0.000 | 0.000
0.000 | 0.000
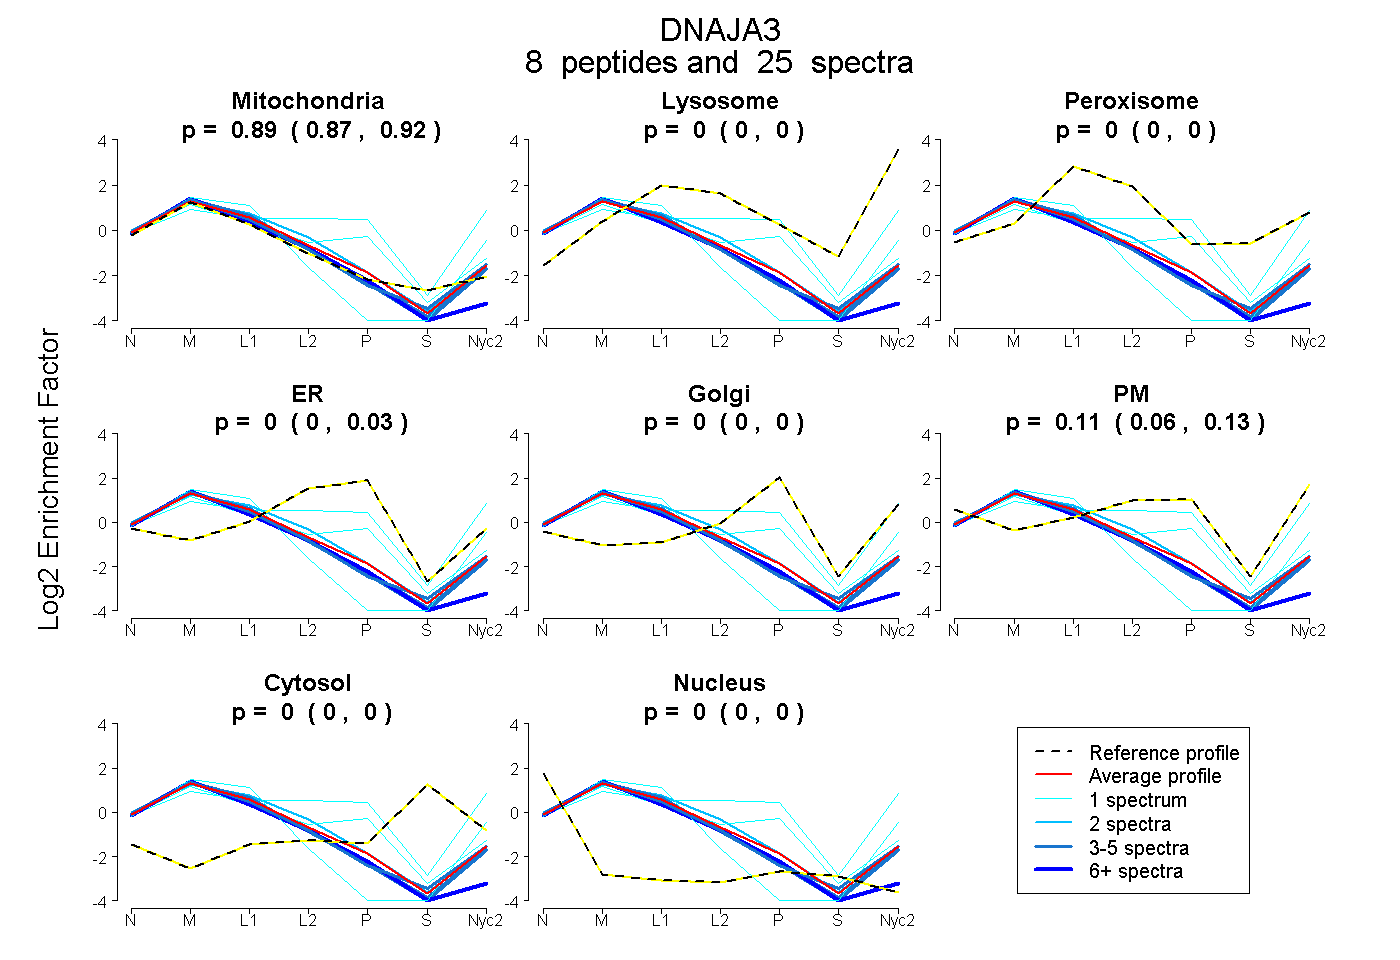
| Plot | Mito | Lyso | Perox | ER | Golgi | PM | Cytosol | Nucleus | |||||
| Expt A |
8 peptides |
25 spectra |
|
0.892 0.865 | 0.915 |
0.000 0.000 | 0.000 |
0.000 0.000 | 0.000 |
0.000 0.000 | 0.031 |
0.000 0.000 | 0.000 |
0.108 0.060 | 0.129 |
0.000 0.000 | 0.000 |
0.000 0.000 | 0.000 |
| 9 spectra, GSIITNPCVVCR | 0.975 | 0.000 | 0.000 | 0.000 | 0.000 | 0.000 | 0.000 | 0.025 | ||
| 1 spectrum, INSYGYGDHYIHIK | 0.965 | 0.035 | 0.000 | 0.000 | 0.000 | 0.000 | 0.000 | 0.000 | ||
| 1 spectrum, GNEPGTK | 0.648 | 0.000 | 0.000 | 0.235 | 0.088 | 0.029 | 0.000 | 0.000 | ||
| 1 spectrum, AYYQLAK | 0.280 | 0.155 | 0.000 | 0.075 | 0.000 | 0.490 | 0.000 | 0.000 | ||
| 3 spectra, EIFVTFR | 0.980 | 0.000 | 0.000 | 0.000 | 0.000 | 0.020 | 0.000 | 0.000 | ||
| 3 spectra, VTVPVPAGVEDGQTVR | 0.961 | 0.017 | 0.000 | 0.000 | 0.000 | 0.022 | 0.000 | 0.000 | ||
| 2 spectra, EAGEDNEGFLSK | 0.873 | 0.000 | 0.008 | 0.044 | 0.000 | 0.076 | 0.000 | 0.000 | ||
| 5 spectra, GGPSVDPEELFR | 0.963 | 0.000 | 0.000 | 0.000 | 0.000 | 0.037 | 0.000 | 0.000 |
| Plot | Mito | Lyso or Perox | ER | Golgi | PM | Cytosol | Nucleus | ||||||
| Expt B |
4 peptides |
12 spectra |
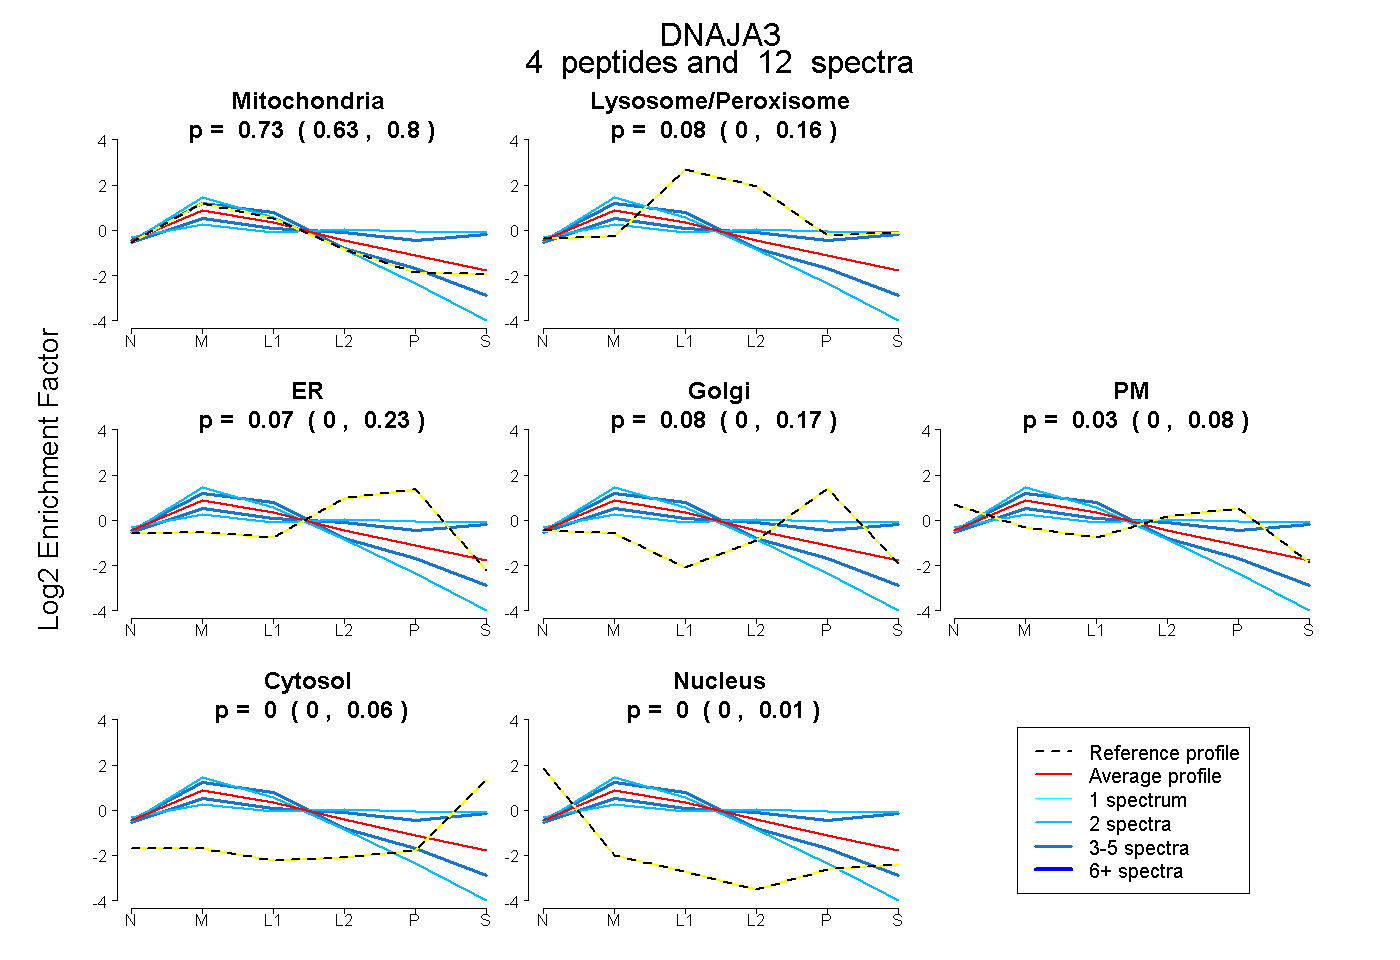 |
0.734 0.631 | 0.799 |
0.082 0.000 | 0.161 |
0.070 0.000 | 0.225 |
0.082 0.000 | 0.173 |
0.032 0.000 | 0.078 |
0.000 0.000 | 0.057 |
0.000 0.000 | 0.007 |
|||
| Plot | Lyso | Other | |||||||||||
| Expt C |
11 peptides |
138 spectra |
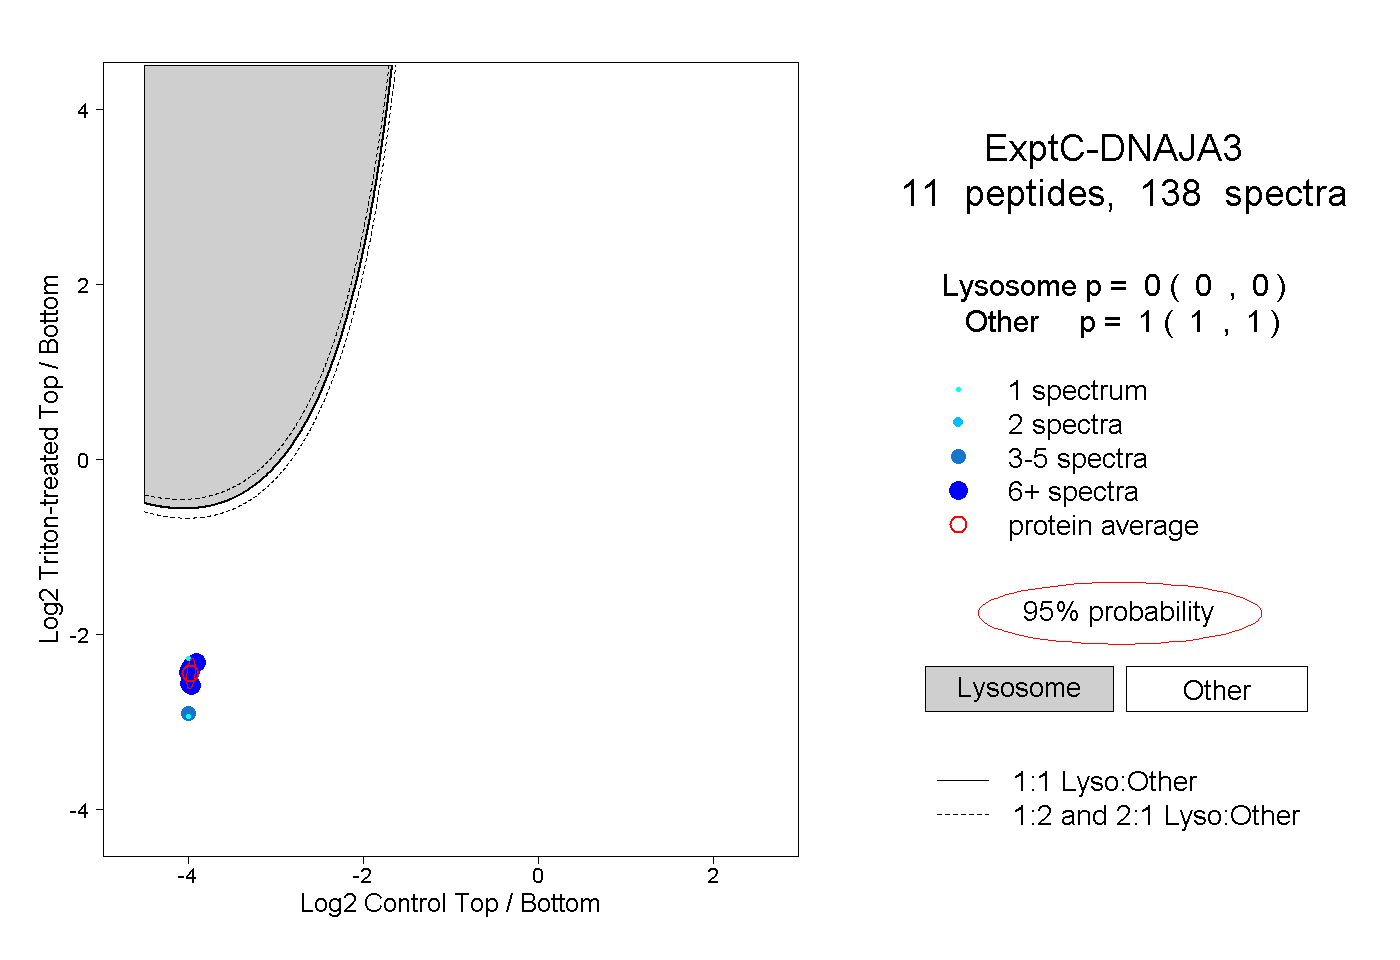 |
0.000 0.000 | 0.000 |
1.000 1.000 | 1.000 |
||||||||
| Plot | Lyso | Other | |||||||||||
| Expt D |
7 peptides |
10 spectra |
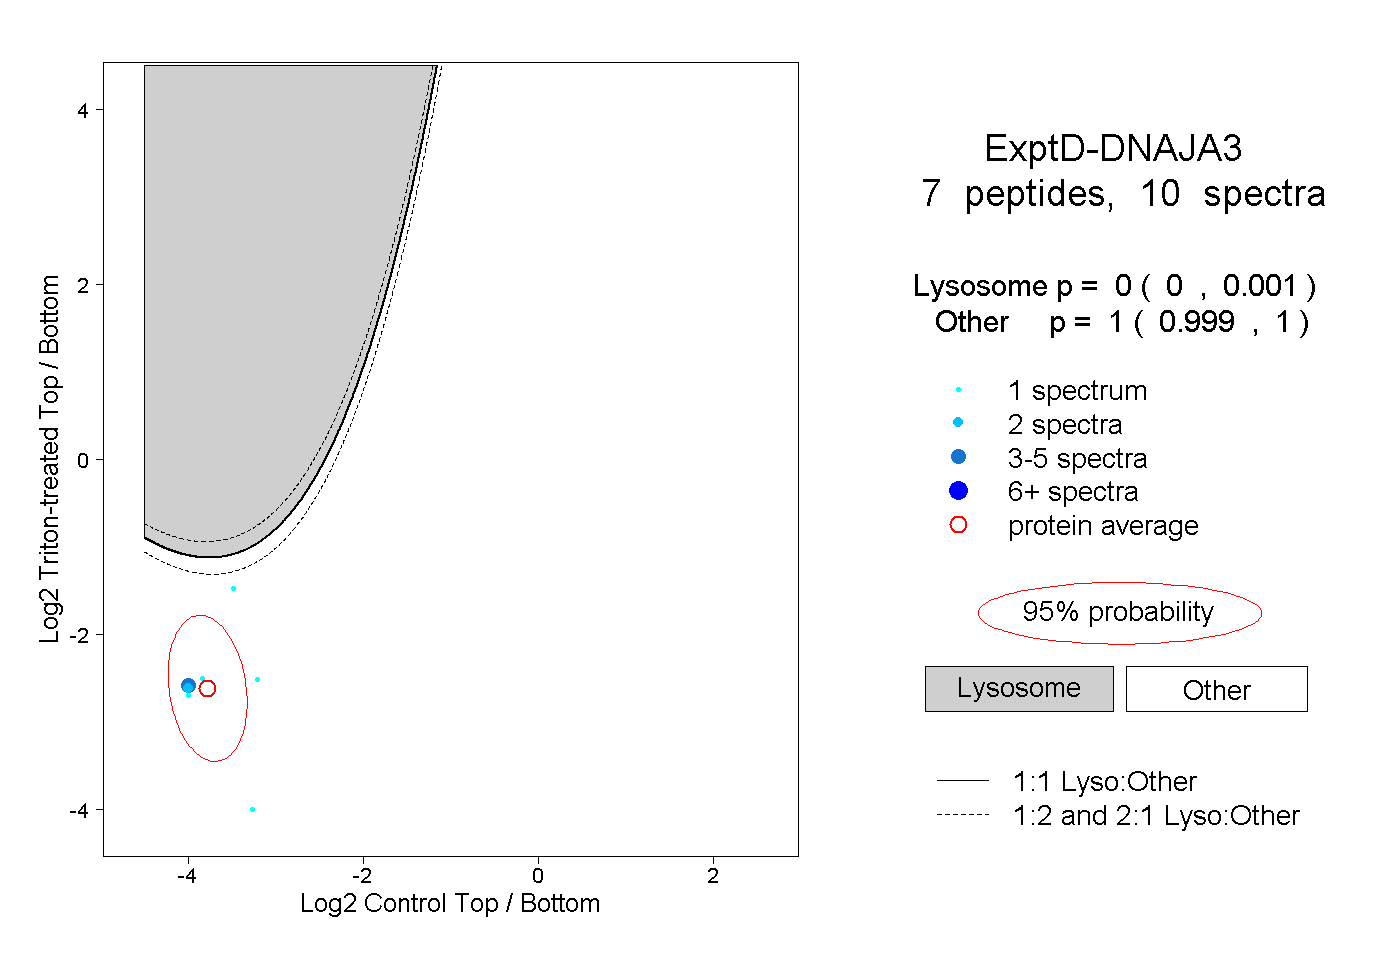 |
0.000 0.000 | 0.001 |
1.000 0.999 | 1.000 |