 17
17peptides
spectra
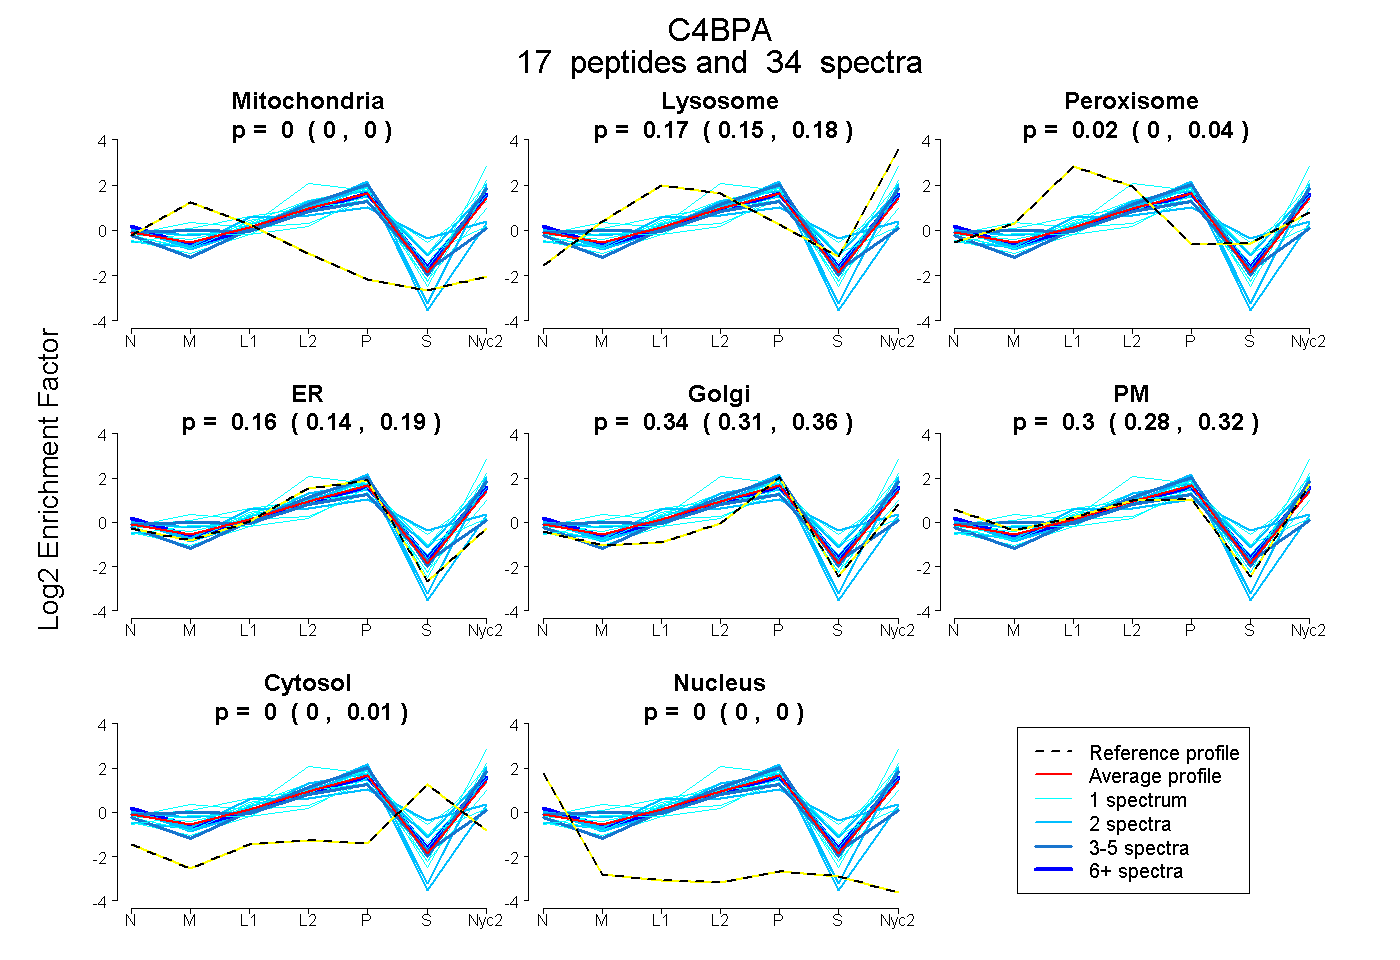
0.000 | 0.000
0.150 | 0.184
0.000 | 0.041
0.139 | 0.190
0.307 | 0.365
0.279 | 0.323
0.000 | 0.010
0.000 | 0.000
5peptides
spectra
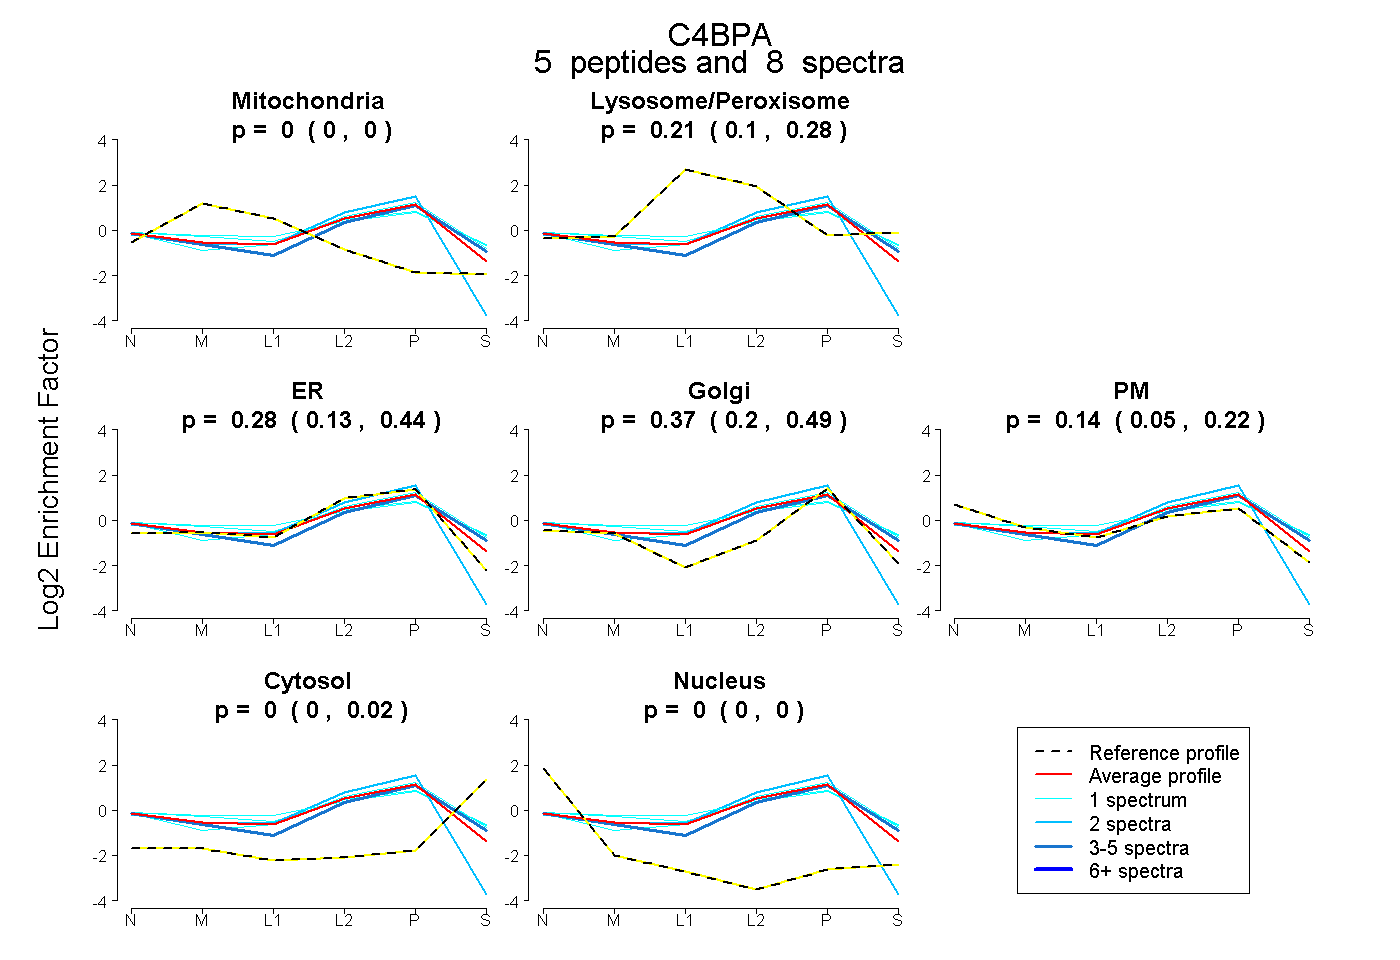
0.000 | 0.000
0.104 | 0.284
0.132 | 0.442
0.196 | 0.488
0.049 | 0.224
0.000 | 0.019
0.000 | 0.000
26peptides
spectra
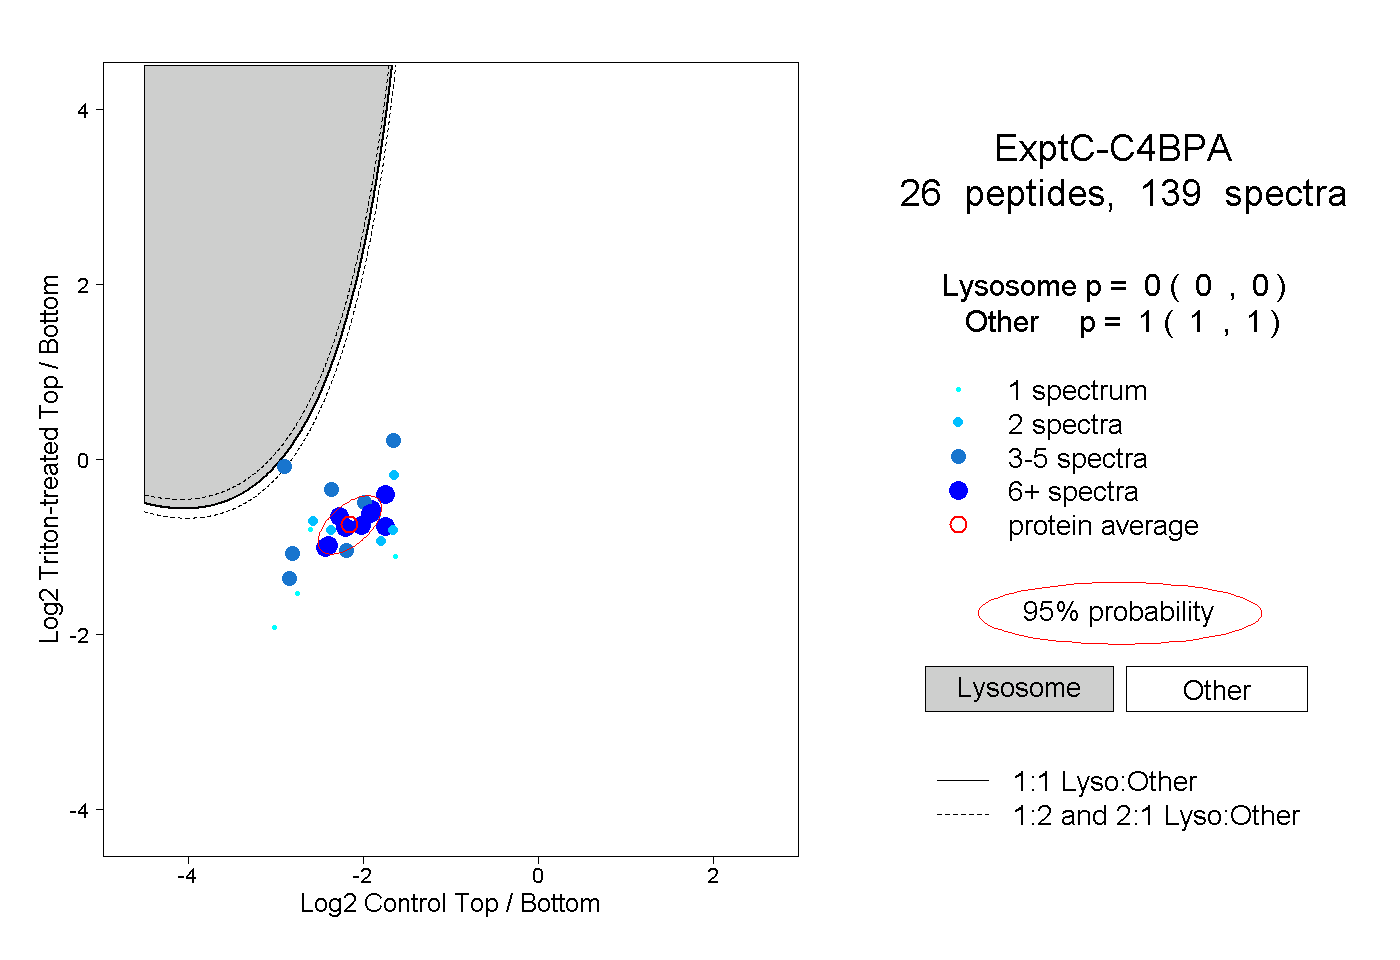
0.000 | 0.000
1.000 | 1.000
8peptides
spectra
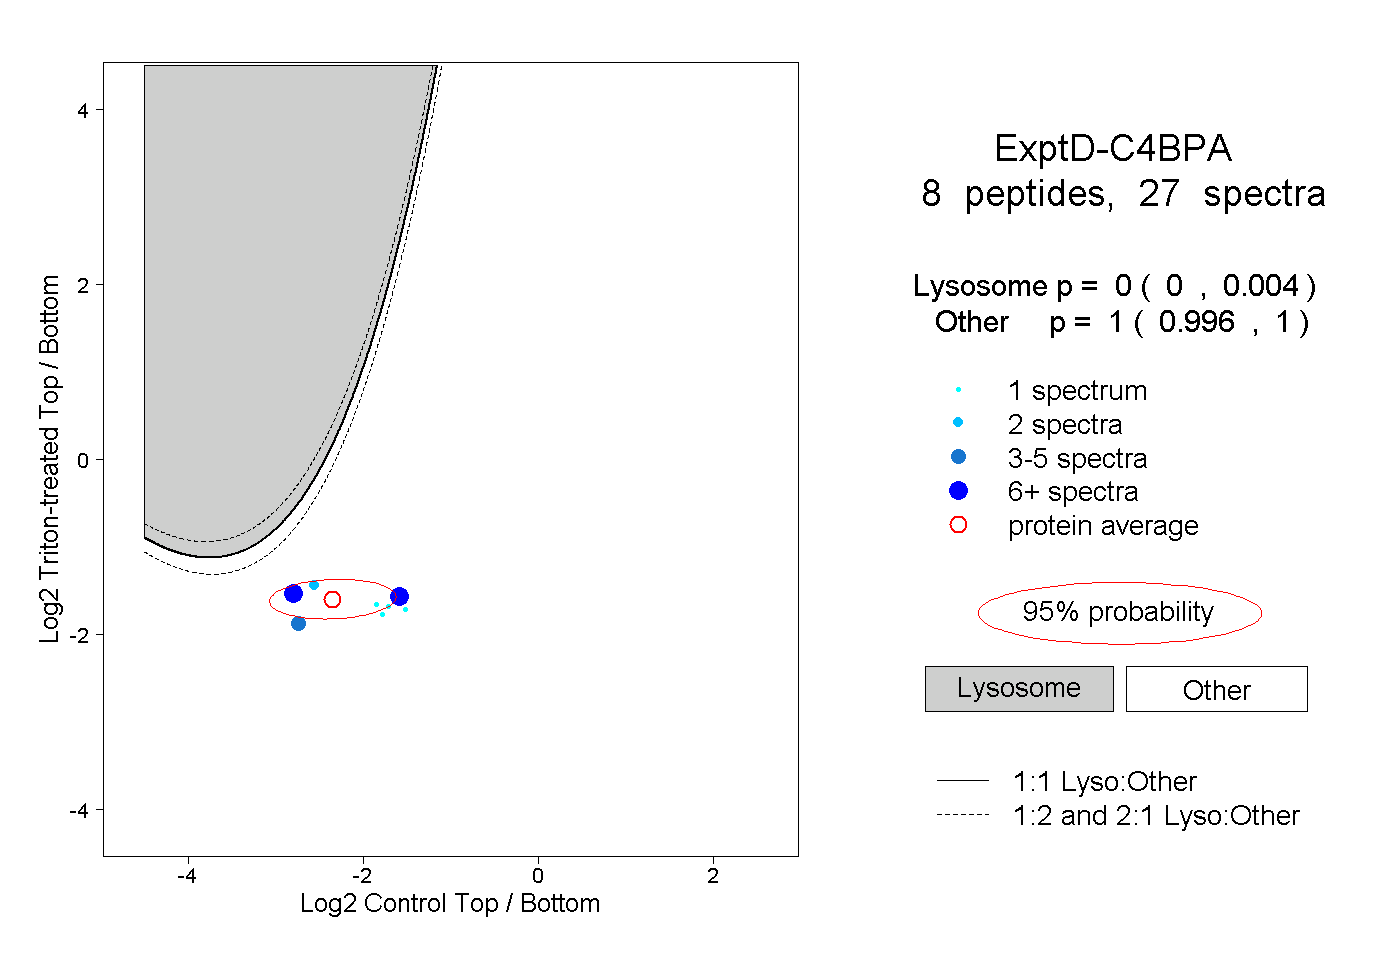
0.000 | 0.004
0.996 | 1.000