C4BPA
[ENSRNOP00000005461]
Main page
| | | Plot |
Mito |
Lyso |
|
Perox |
ER |
Golgi |
PM |
Cytosol |
Nucleus |
|
| Expt A |
 17
17
peptides |
34
spectra |
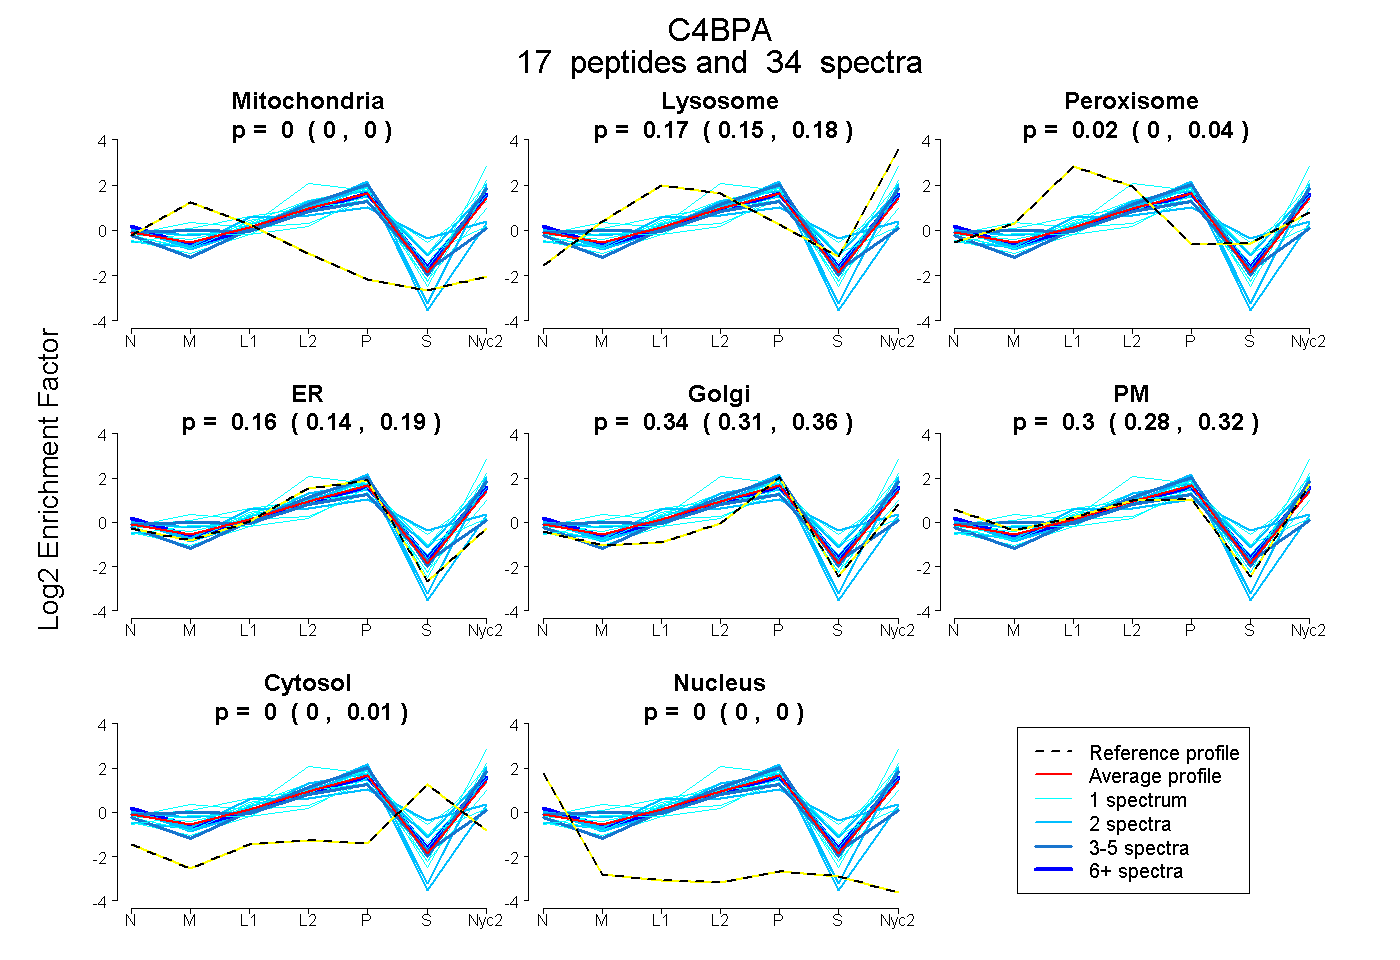 |
0.000
0.000 | 0.000 |
0.167
0.150 | 0.184 |
|
0.024
0.000 | 0.041 |
0.163
0.139 | 0.190 |
0.344
0.307 | 0.365 |
0.301
0.279 | 0.323 |
0.001
0.000 | 0.010 |
0.000
0.000 | 0.000 |
|
| | | Plot |
Mito |
|
Lyso or Perox |
|
ER |
Golgi |
PM |
Cytosol |
Nucleus |
|
| Expt B |
5
peptides |
8
spectra |
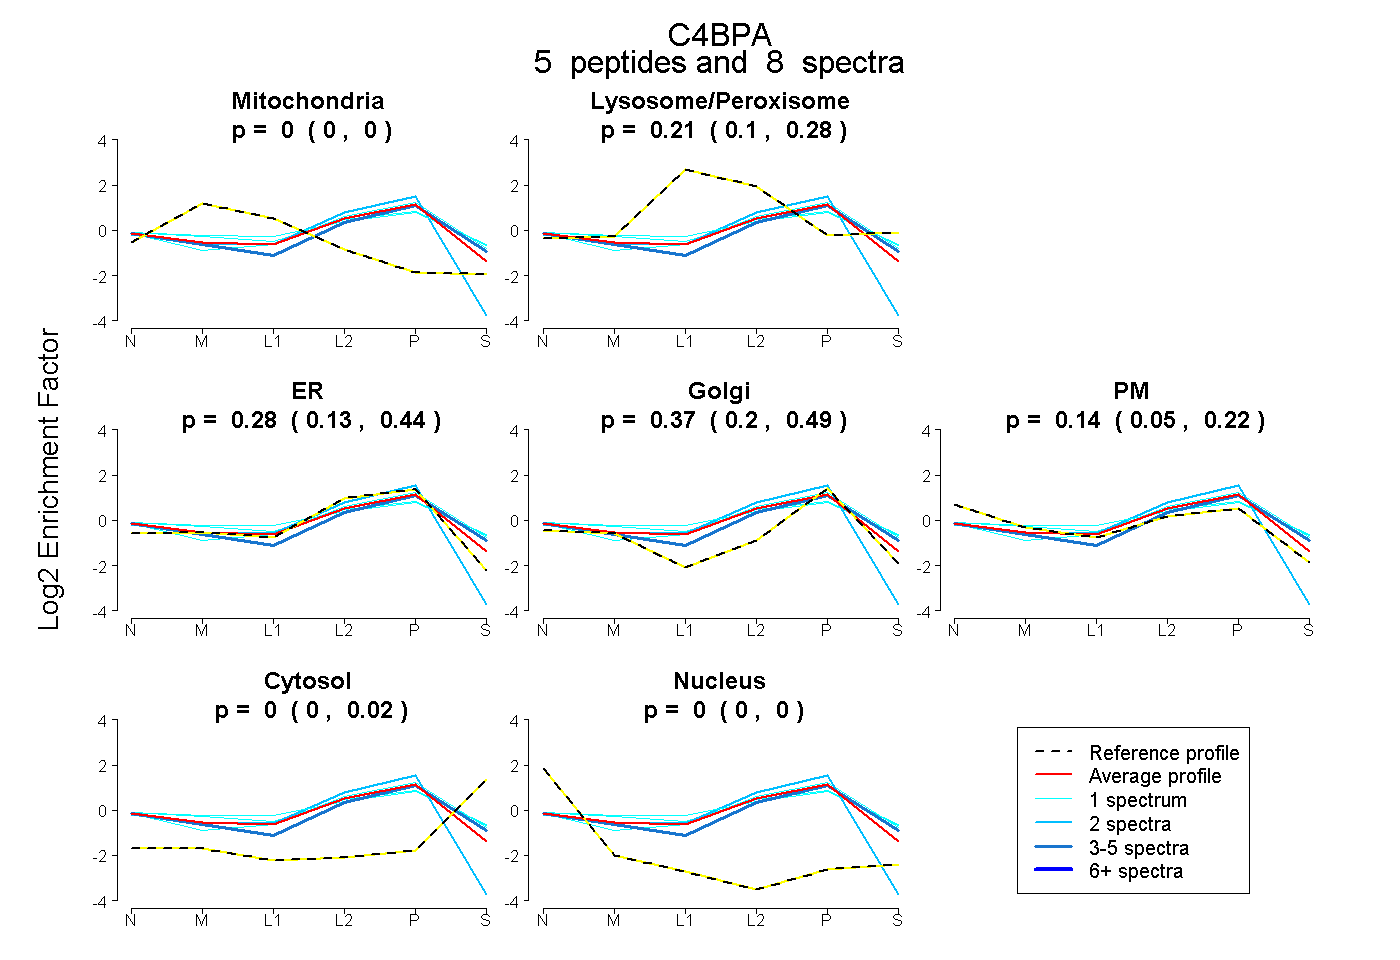 |
0.000
0.000 | 0.000 |
|
0.210
0.104 | 0.284 |
|
0.284
0.132 | 0.442 |
0.367
0.196 | 0.488 |
0.139
0.049 | 0.224 |
0.000
0.000 | 0.019 |
0.000
0.000 | 0.000 |
|
| | | Plot |
|
Lyso |
|
|
|
|
|
|
|
Other |
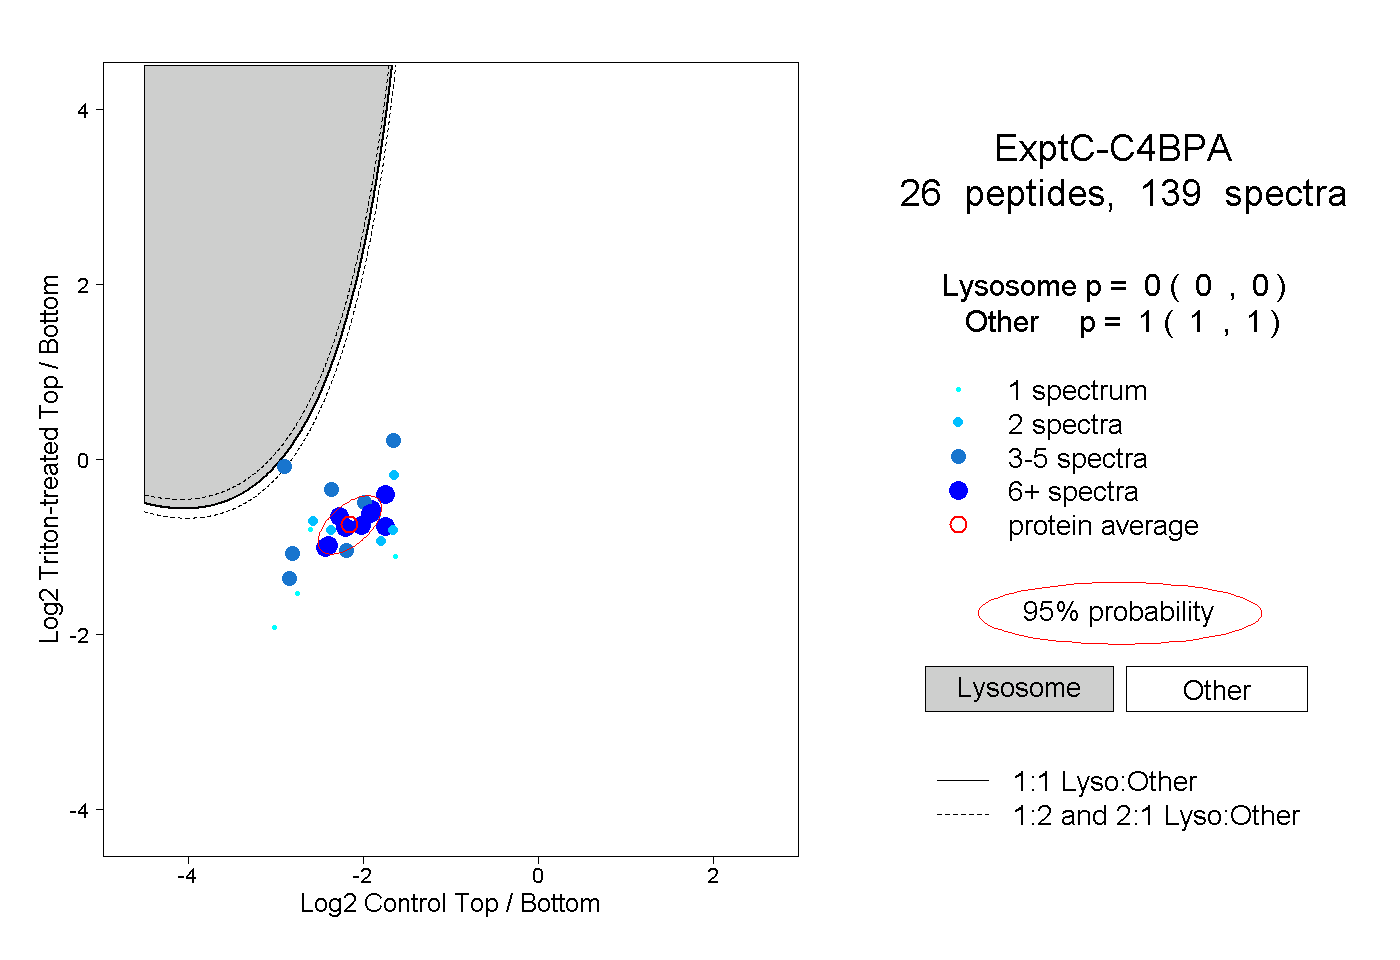
| Expt C |
26
peptides |
139
spectra |
 |
|
0.000
0.000 | 0.000 |
|
|
|
|
|
|
|
1.000
1.000 | 1.000 |
| | | Plot |
|
Lyso |
|
|
|
|
|
|
|
Other |
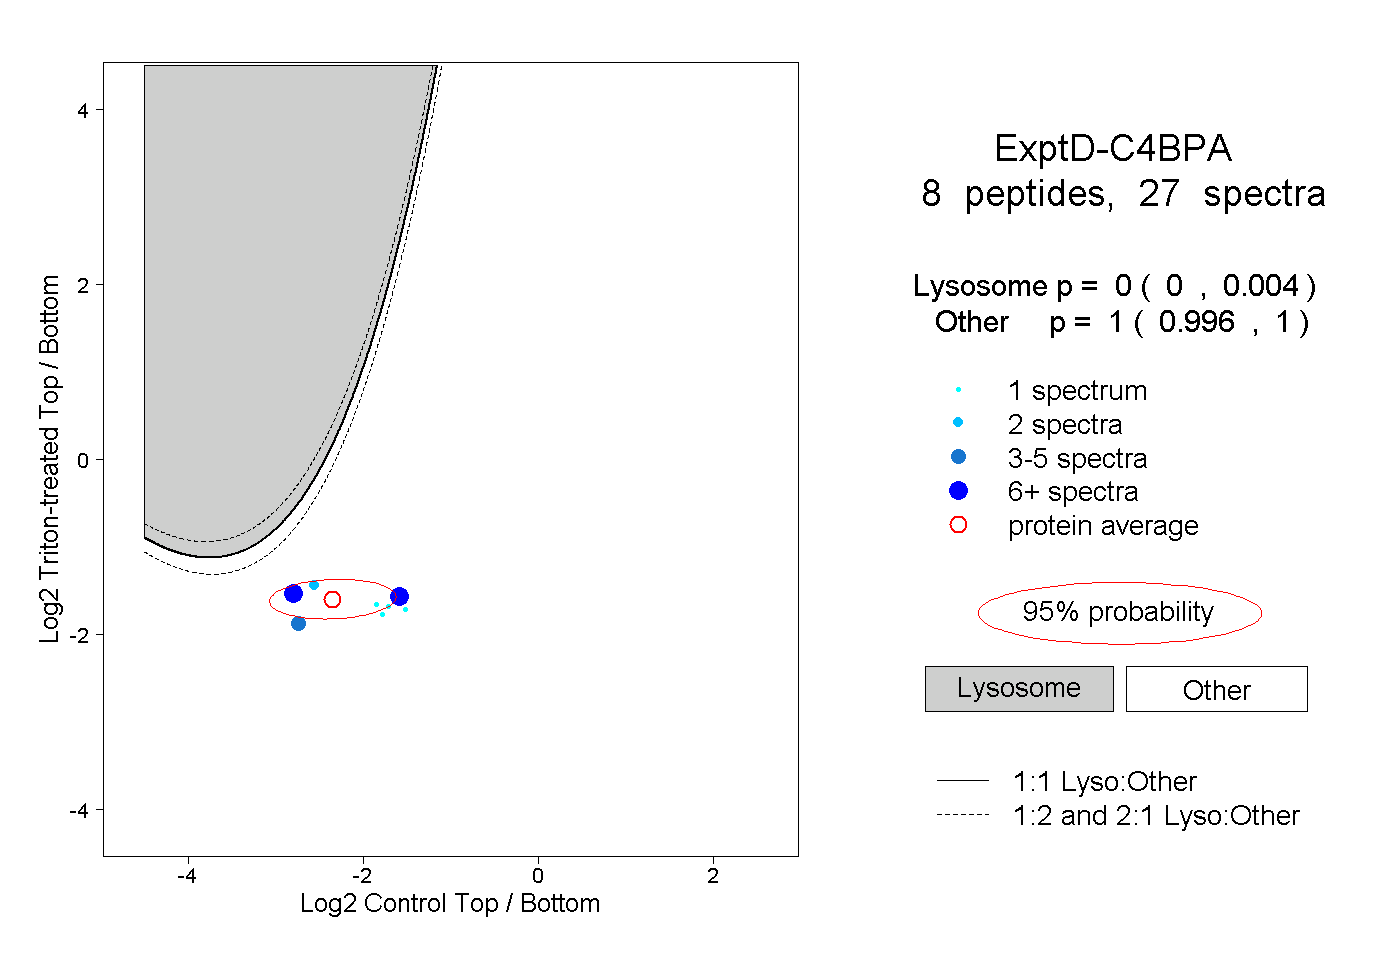
| Expt D |
8
peptides |
27
spectra |
 |
|
0.000
0.000 | 0.004 |
|
|
|
|
|
|
|
1.000
0.996 | 1.000 |
| 1 spectrum, LTLELK |
|
0.000 |
|
|
|
|
|
|
|
1.000 |
| 1 spectrum, QLQLQIDK |
|
0.000 |
|
|
|
|
|
|
|
1.000 |
| 3 spectra, MALEVYK |
|
0.000 |
|
|
|
|
|
|
|
1.000 |
| 6 spectra, TQVTYECEEGYR |
|
0.000 |
|
|
|
|
|
|
|
1.000 |
| 1 spectrum, SSVTYK |
|
0.000 |
|
|
|
|
|
|
|
1.000 |
| 12 spectra, YNCRPGYSR |
|
0.003 |
|
|
|
|
|
|
|
0.997 |
| 1 spectrum, VIQHEK |
|
0.000 |
|
|
|
|
|
|
|
1.000 |
| 2 spectra, YICRPGYEPATR |
|
0.001 |
|
|
|
|
|
|
|
0.999 |