 13
13peptides
spectra
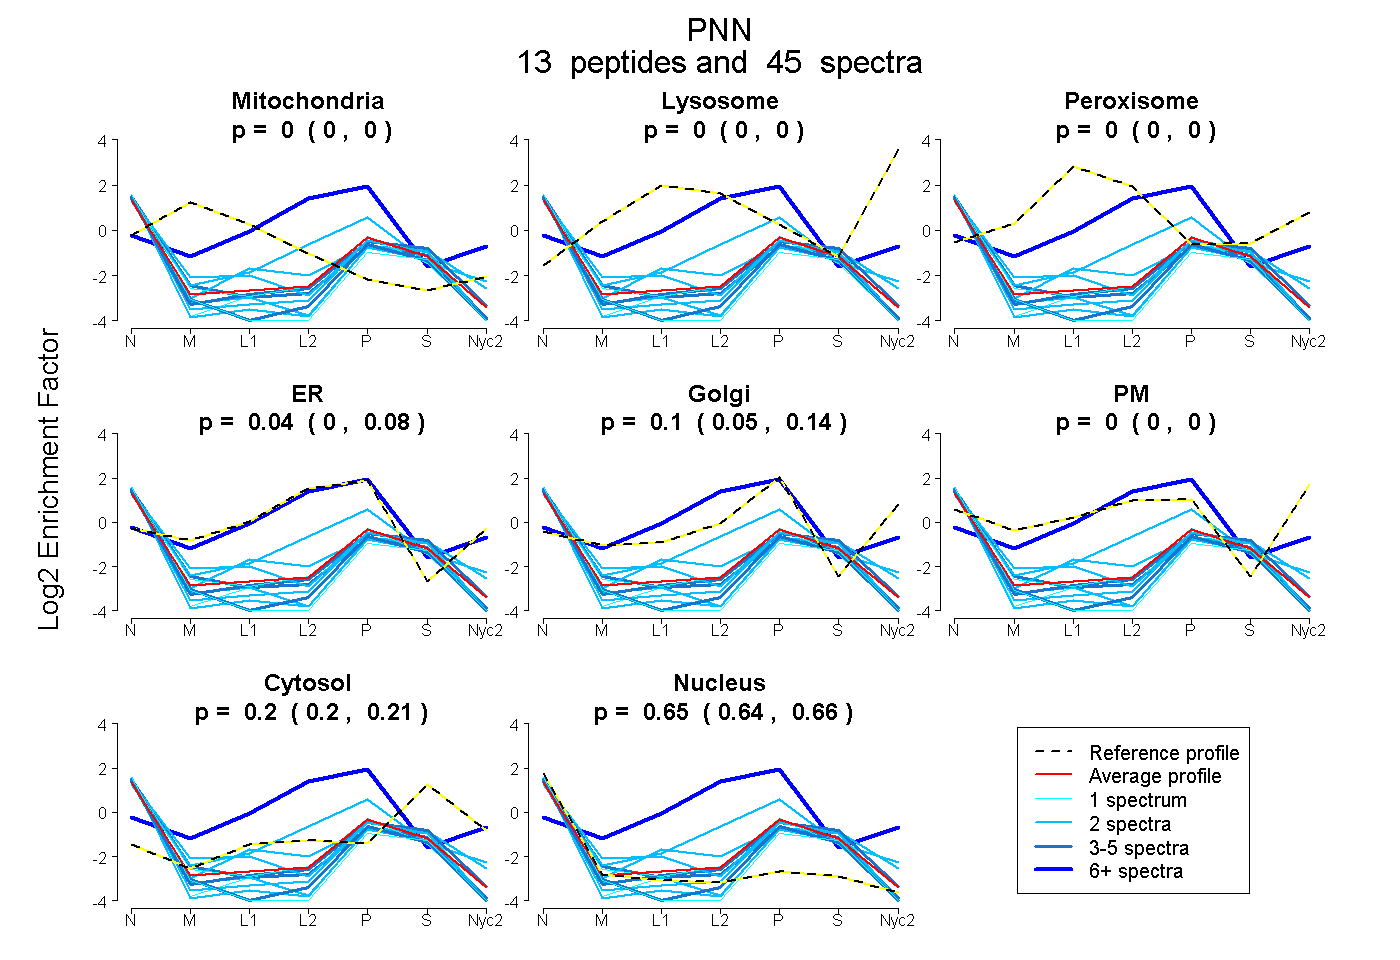
0.000 | 0.000
0.000 | 0.000
0.000 | 0.000
0.000 | 0.081
0.049 | 0.137
0.000 | 0.000
0.196 | 0.211
0.644 | 0.664
2peptides
spectra
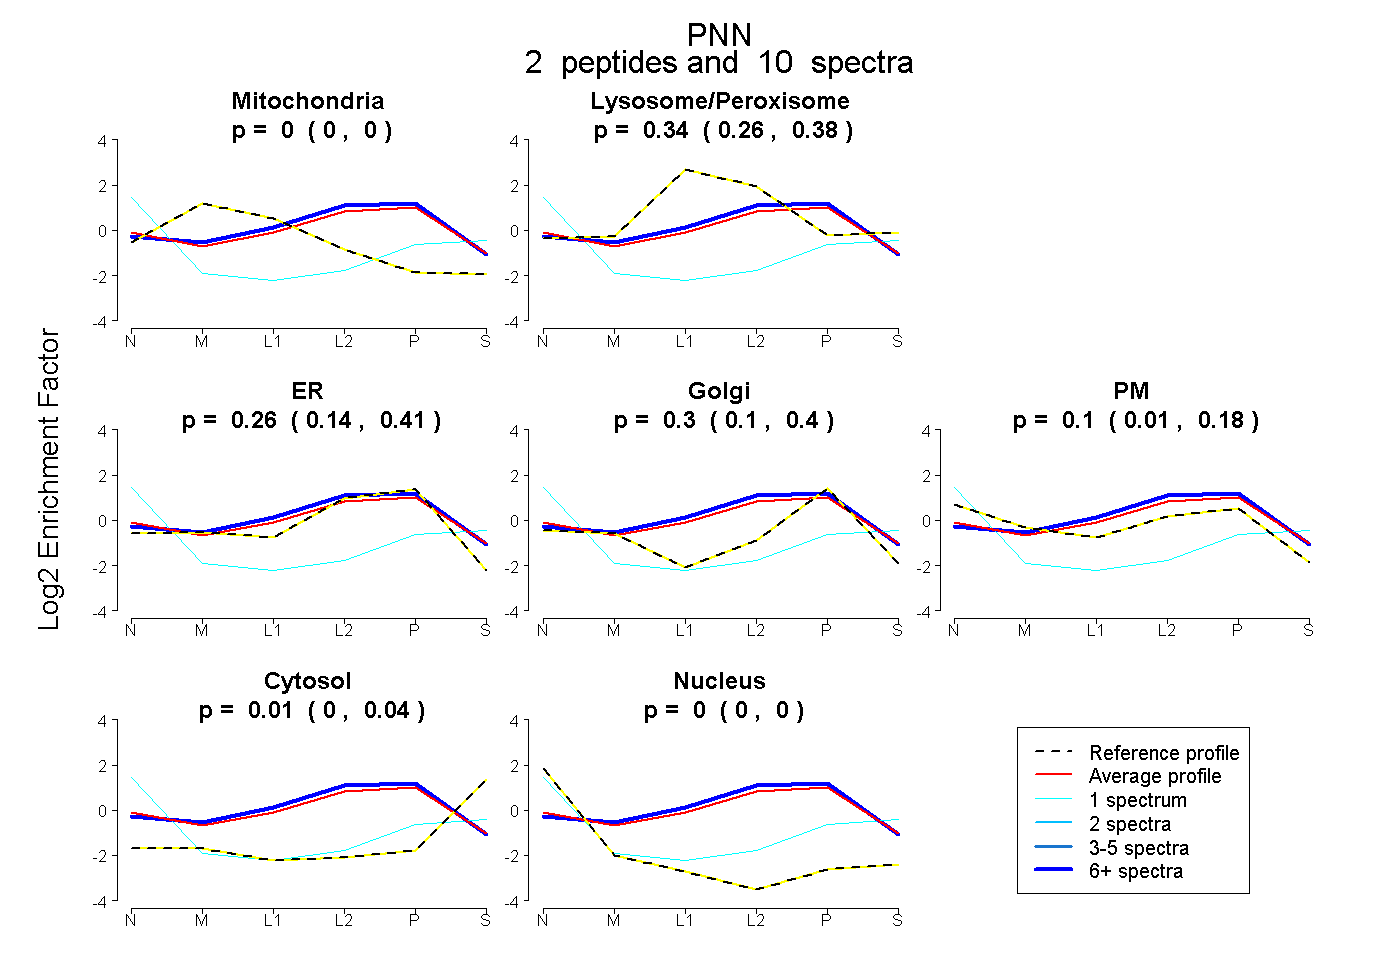
0.000 | 0.000
0.261 | 0.383
0.140 | 0.411
0.098 | 0.395
0.012 | 0.181
0.000 | 0.044
0.000 | 0.000