 12
12peptides
spectra
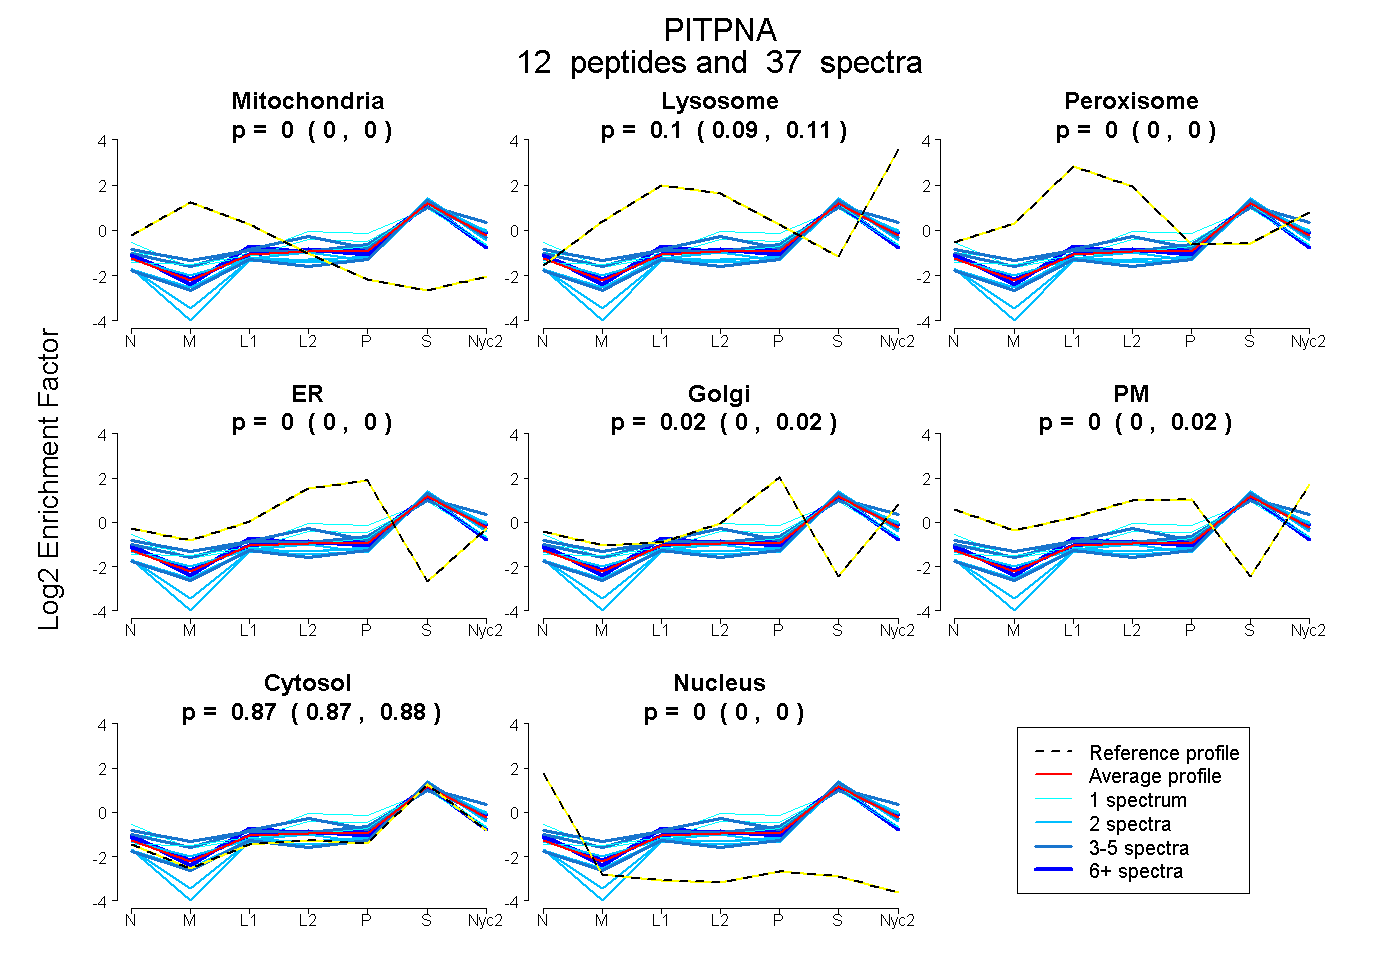
0.000 | 0.000
0.094 | 0.110
0.000 | 0.000
0.000 | 0.000
0.000 | 0.024
0.000 | 0.023
0.869 | 0.879
0.000 | 0.000
2peptides
spectra
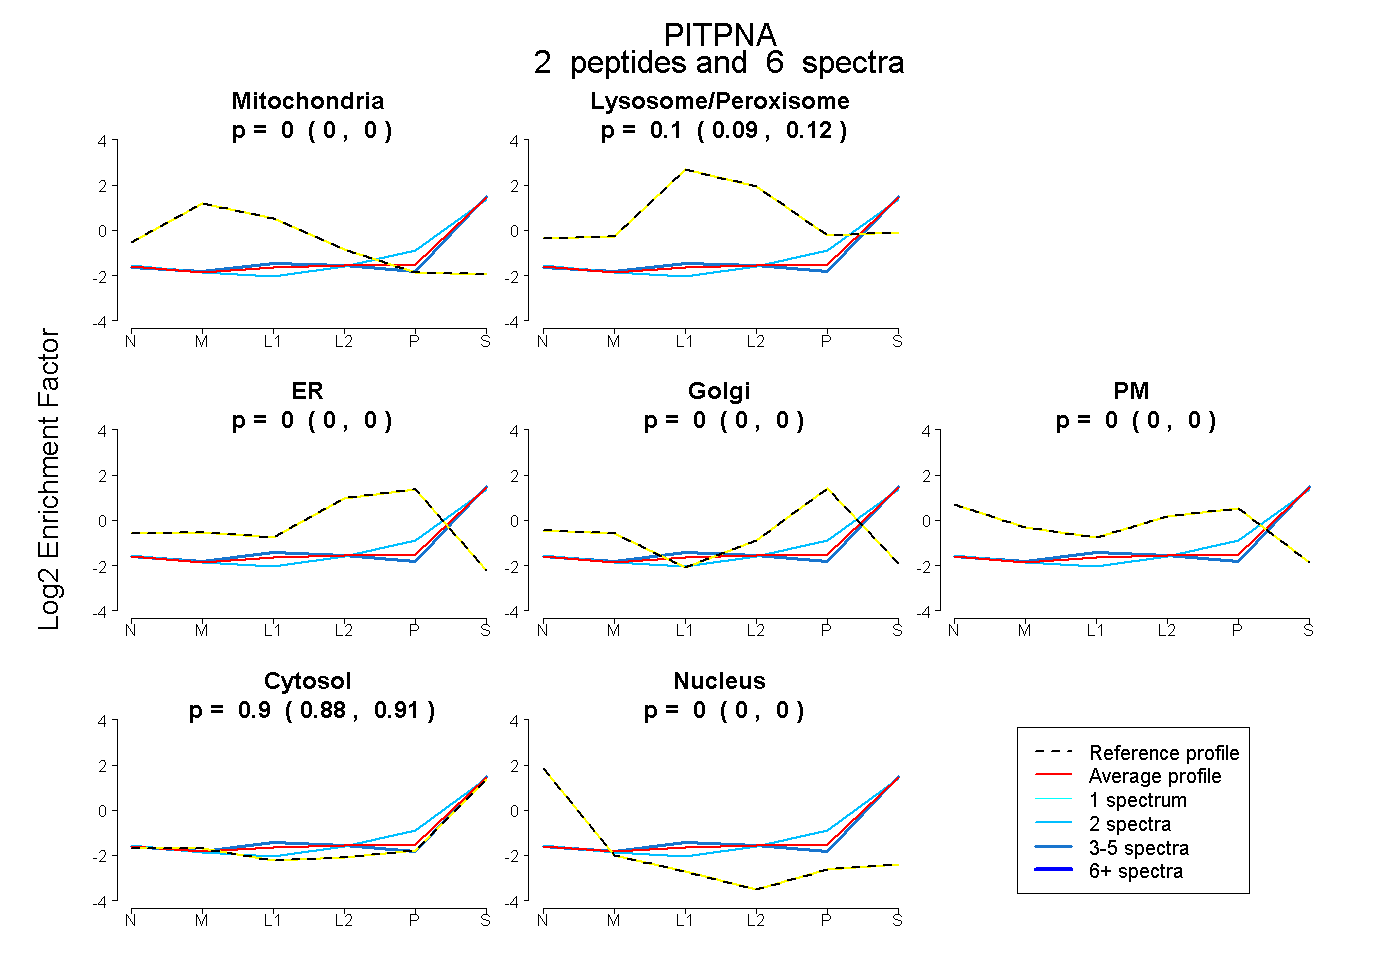
0.000 | 0.000
0.091 | 0.117
0.000 | 0.000
0.000 | 0.000
0.000 | 0.000
0.881 | 0.907
0.000 | 0.000
11peptides
spectra
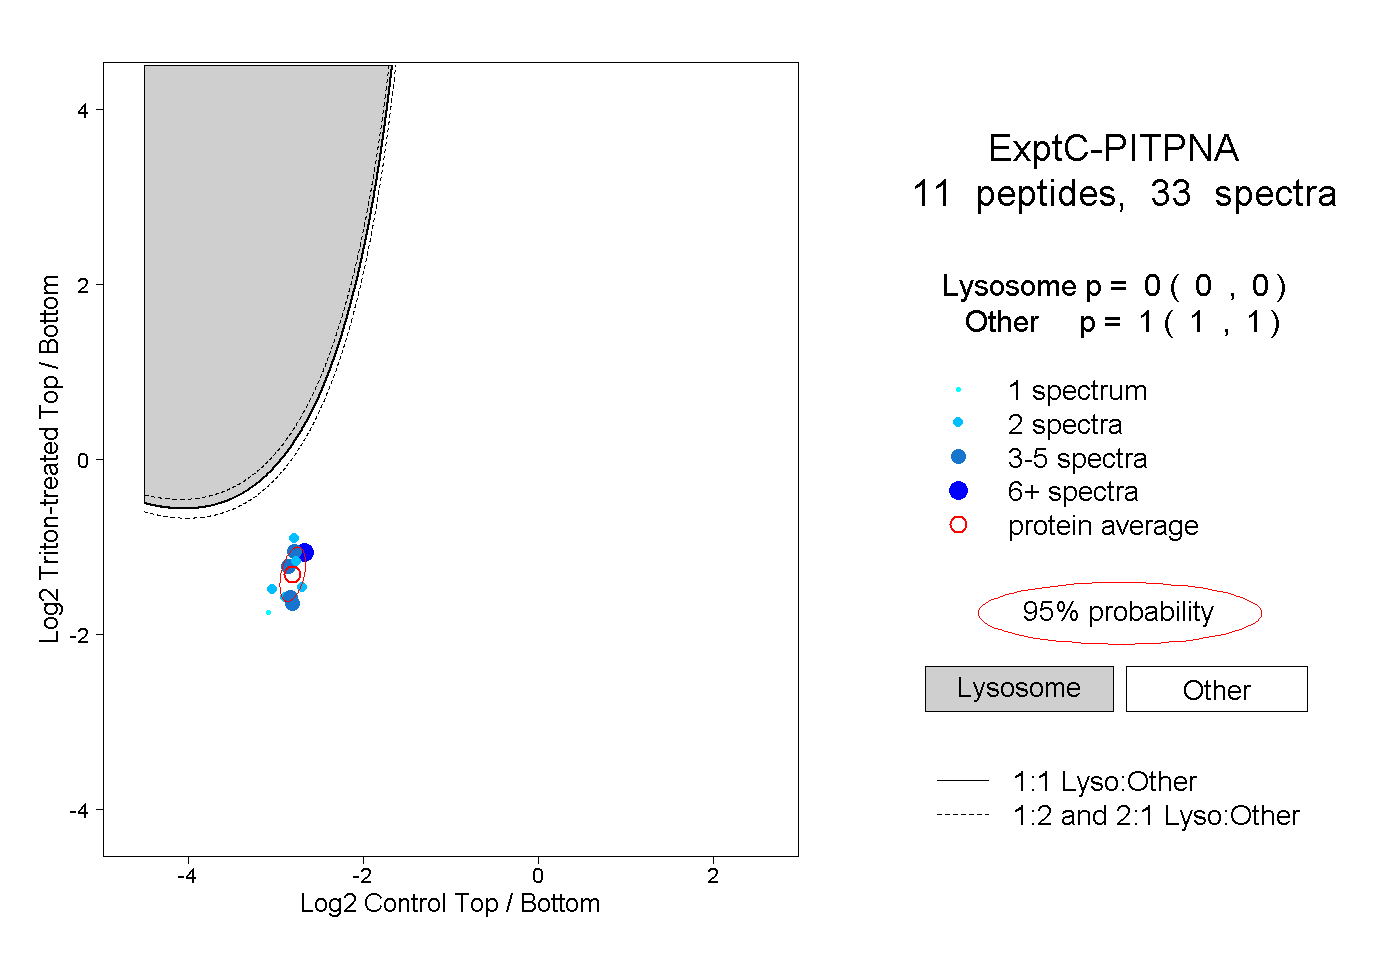
0.000 | 0.000
1.000 | 1.000
1peptide
spectra
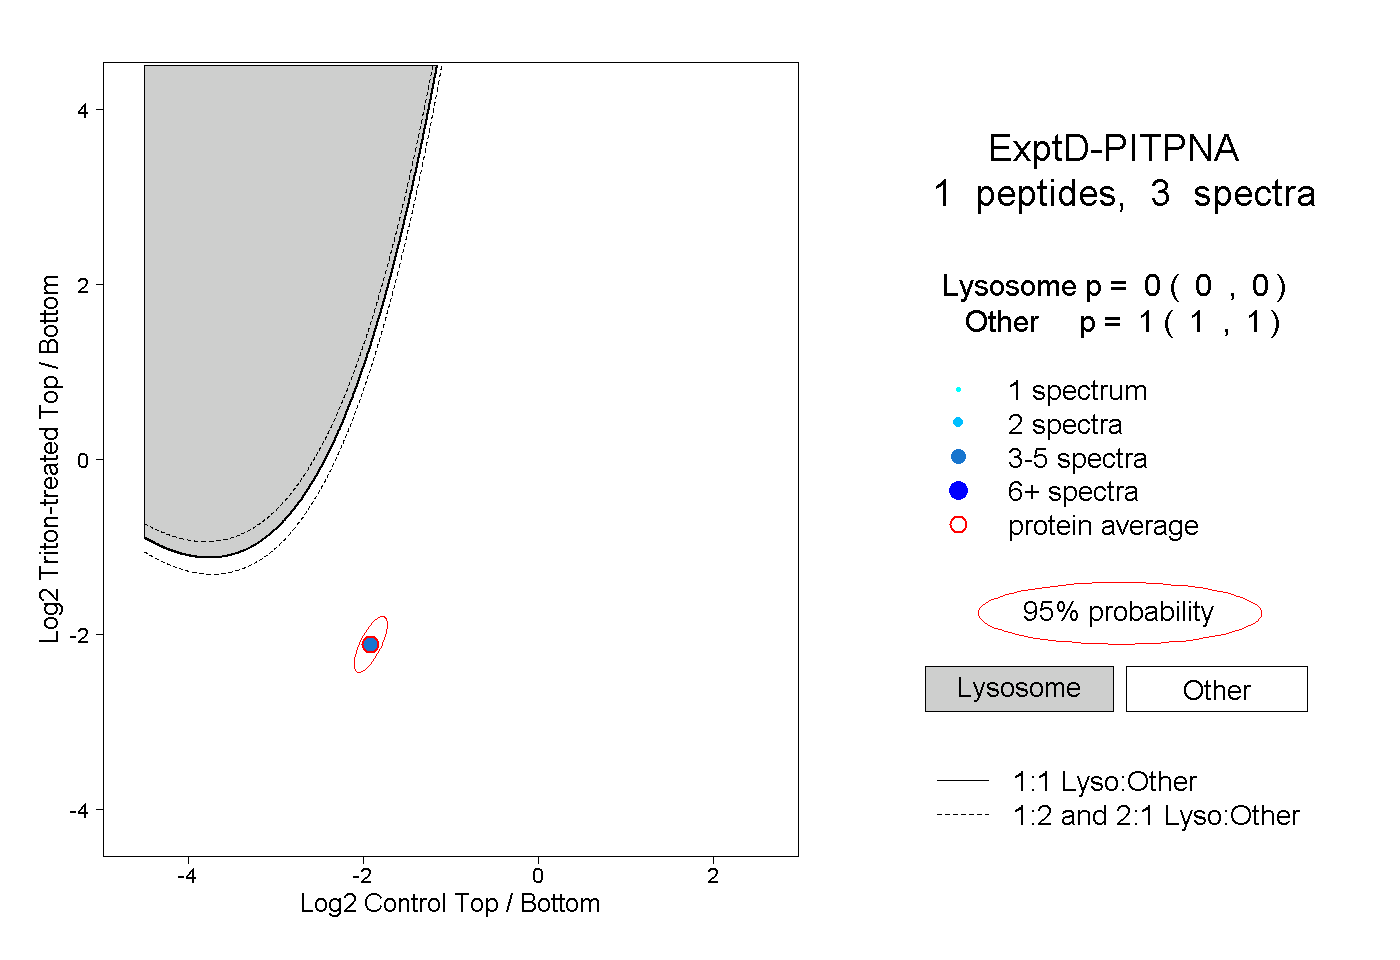
0.000 | 0.000
1.000 | 1.000