 12
12peptides
spectra
0.000 | 0.000
0.094 | 0.110
0.000 | 0.000
0.000 | 0.000
0.000 | 0.024
0.000 | 0.023
0.869 | 0.879
0.000 | 0.000
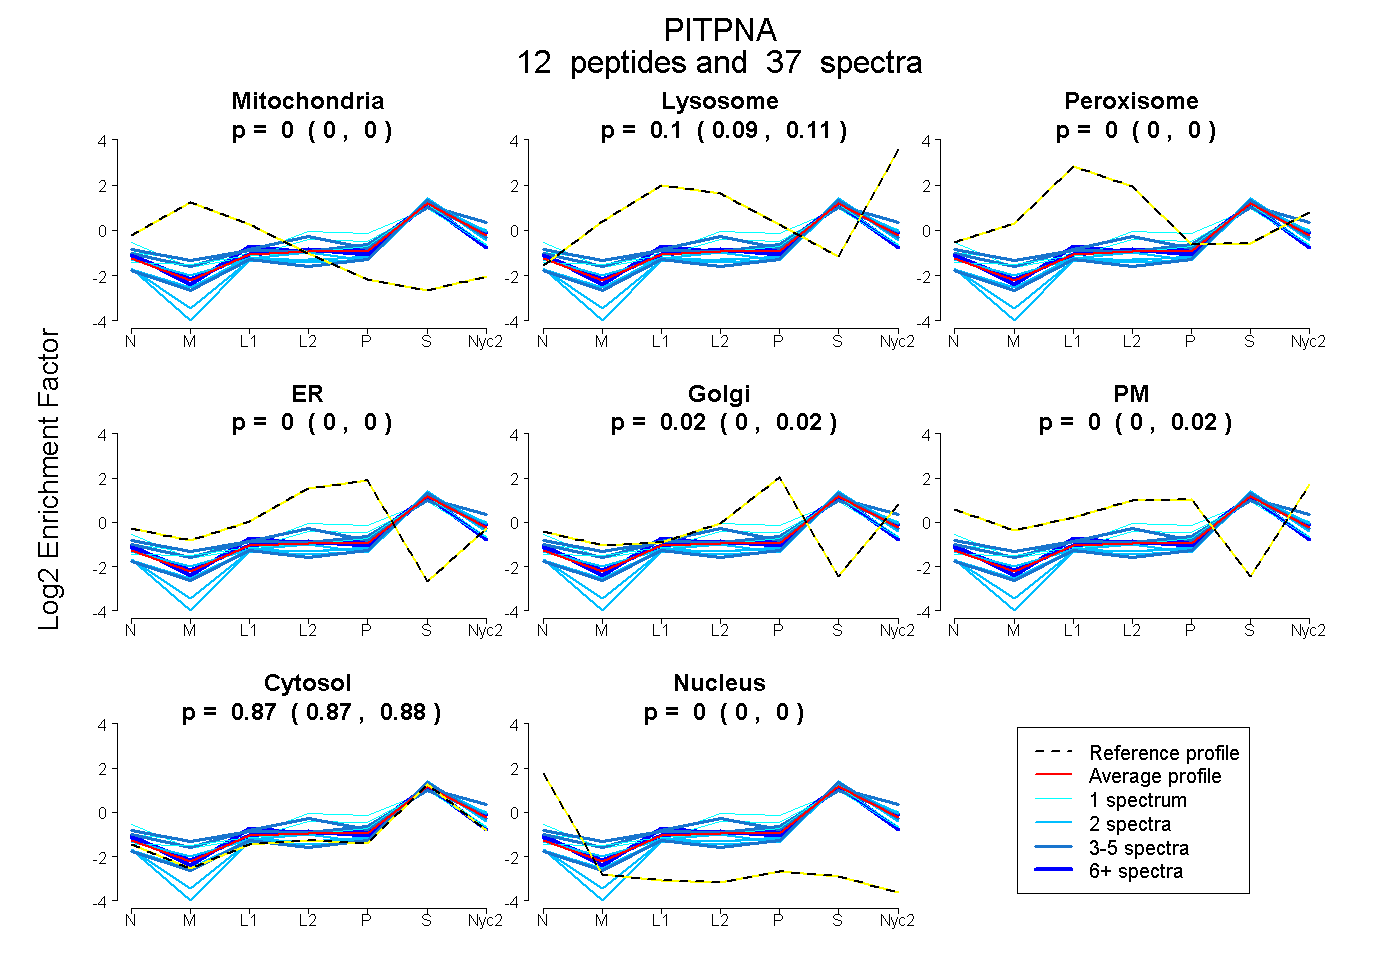
| Plot | Mito | Lyso | Perox | ER | Golgi | PM | Cytosol | Nucleus | |||||
| Expt A |
12 peptides |
37 spectra |
|
0.000 0.000 | 0.000 |
0.105 0.094 | 0.110 |
0.000 0.000 | 0.000 |
0.000 0.000 | 0.000 |
0.018 0.000 | 0.024 |
0.003 0.000 | 0.023 |
0.874 0.869 | 0.879 |
0.000 0.000 | 0.000 |
| 1 spectrum, HVEAIYIDIADR | 0.000 | 0.000 | 0.046 | 0.131 | 0.000 | 0.074 | 0.749 | 0.000 | ||
| 3 spectra, WVDLTMDDIR | 0.000 | 0.032 | 0.000 | 0.000 | 0.000 | 0.000 | 0.968 | 0.000 | ||
| 2 spectra, IYHLQSK | 0.000 | 0.058 | 0.000 | 0.000 | 0.000 | 0.000 | 0.942 | 0.000 | ||
| 6 spectra, DCPYMCAYK | 0.000 | 0.000 | 0.085 | 0.057 | 0.000 | 0.000 | 0.857 | 0.000 | ||
| 2 spectra, VENFIHK | 0.000 | 0.118 | 0.000 | 0.000 | 0.000 | 0.000 | 0.882 | 0.000 | ||
| 4 spectra, QELVNQK | 0.013 | 0.085 | 0.034 | 0.000 | 0.000 | 0.122 | 0.747 | 0.000 | ||
| 4 spectra, LFTNFHR | 0.000 | 0.209 | 0.014 | 0.000 | 0.000 | 0.044 | 0.732 | 0.000 | ||
| 2 spectra, LEPEAWK | 0.000 | 0.000 | 0.000 | 0.000 | 0.000 | 0.000 | 1.000 | 0.000 | ||
| 2 spectra, VPTFVR | 0.000 | 0.000 | 0.000 | 0.000 | 0.000 | 0.000 | 1.000 | 0.000 | ||
| 1 spectrum, AEEDPAK | 0.000 | 0.158 | 0.000 | 0.139 | 0.000 | 0.028 | 0.675 | 0.000 | ||
| 9 spectra, MLAPEGALNIHEK | 0.000 | 0.113 | 0.000 | 0.000 | 0.000 | 0.029 | 0.858 | 0.000 | ||
| 1 spectrum, QLDEMR | 0.028 | 0.042 | 0.051 | 0.000 | 0.061 | 0.000 | 0.818 | 0.000 |
| Plot | Mito | Lyso or Perox | ER | Golgi | PM | Cytosol | Nucleus | ||||||
| Expt B |
2 peptides |
6 spectra |
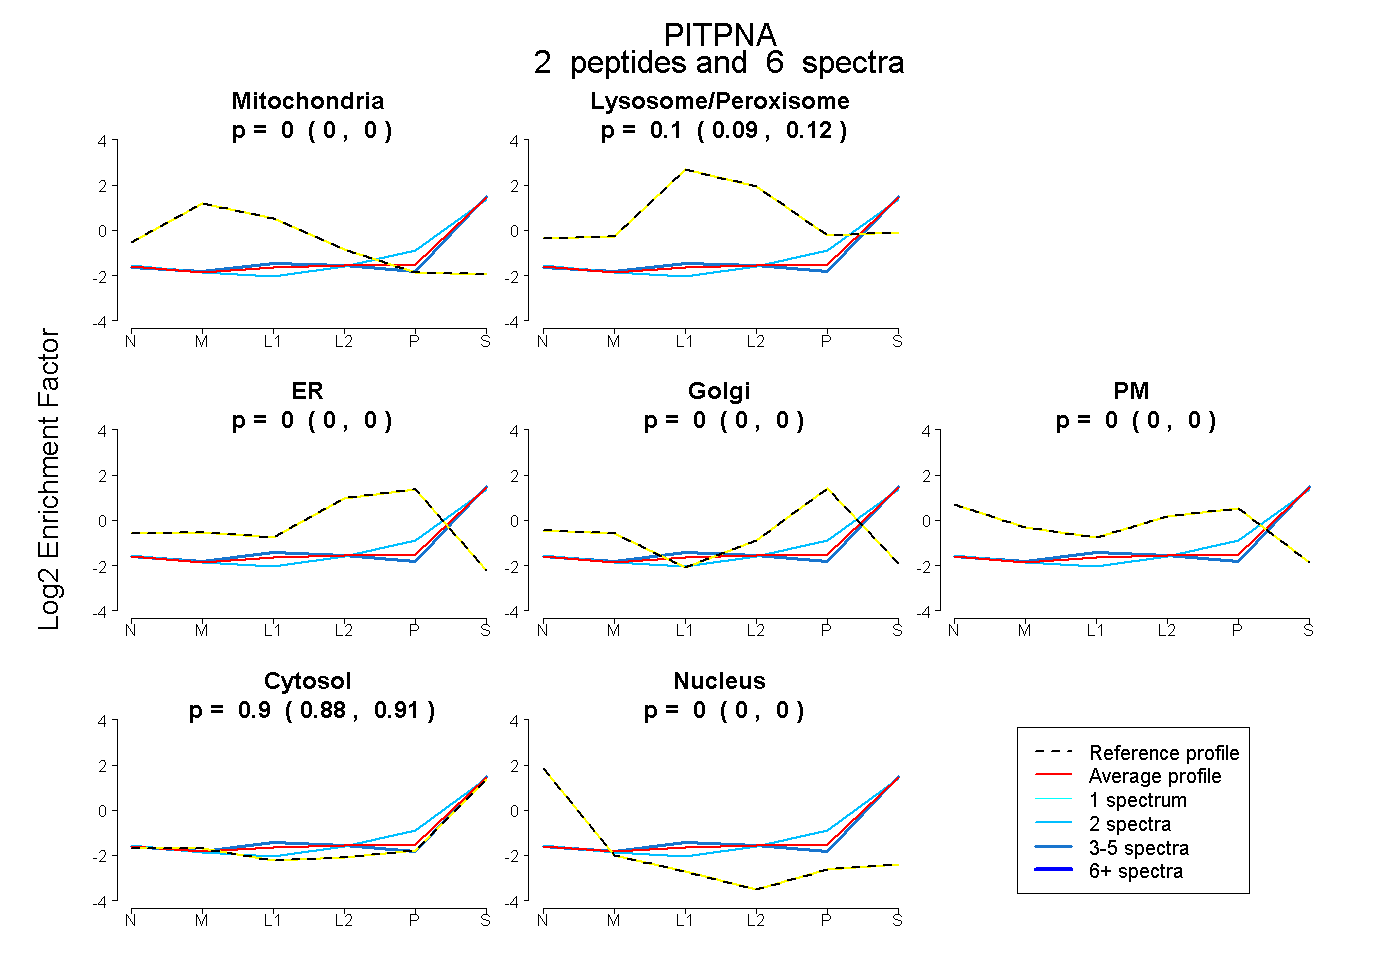 |
0.000 0.000 | 0.000 |
0.104 0.091 | 0.117 |
0.000 0.000 | 0.000 |
0.000 0.000 | 0.000 |
0.000 0.000 | 0.000 |
0.896 0.881 | 0.907 |
0.000 0.000 | 0.000 |
|||
| Plot | Lyso | Other | |||||||||||
| Expt C |
11 peptides |
33 spectra |
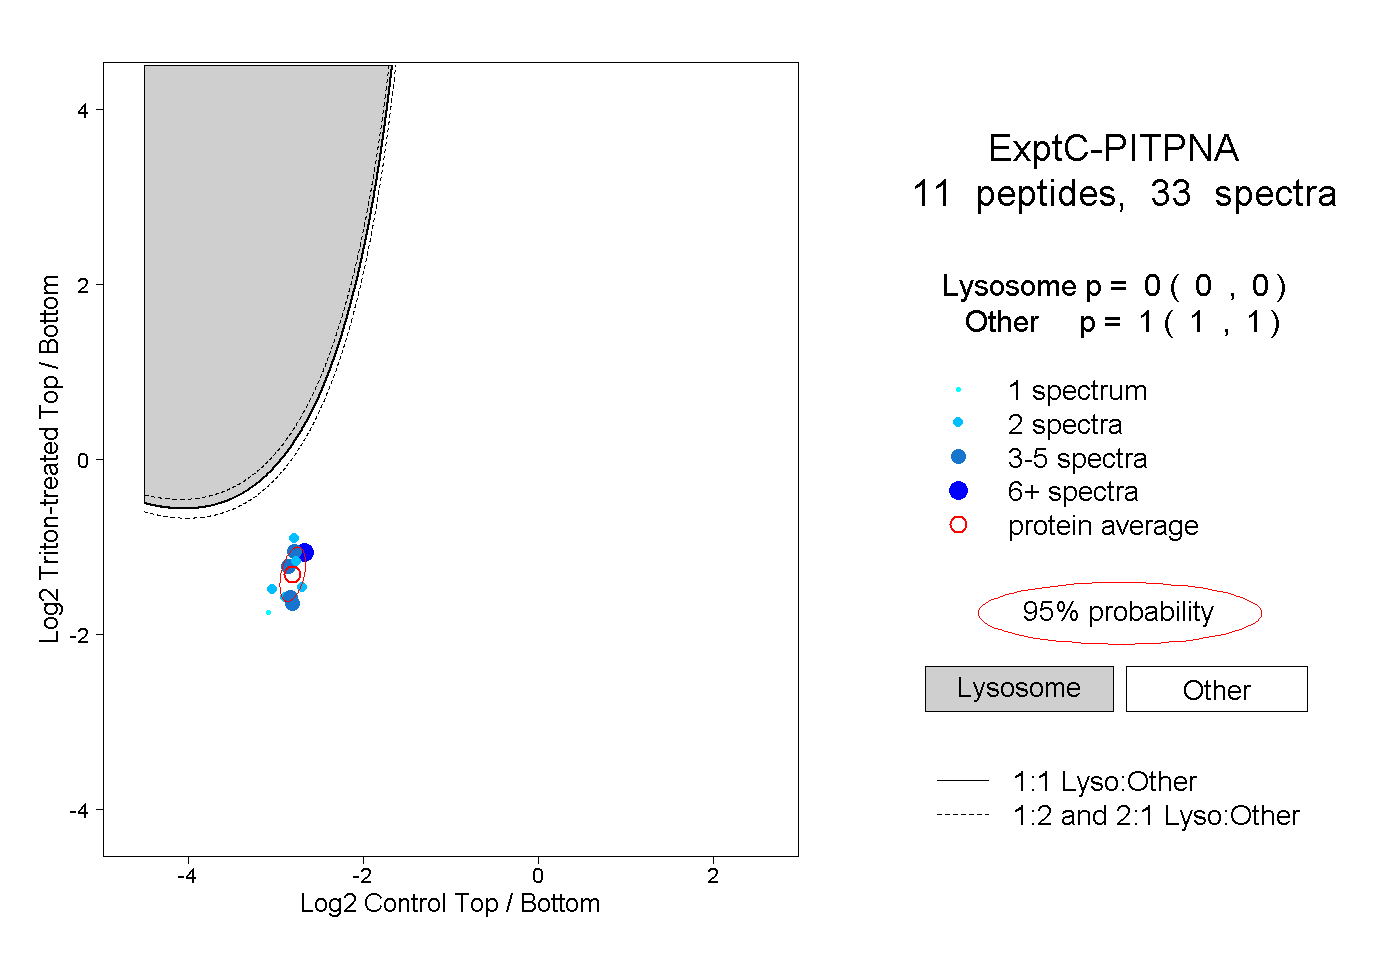 |
0.000 0.000 | 0.000 |
1.000 1.000 | 1.000 |
||||||||
| Plot | Lyso | Other | |||||||||||
| Expt D |
1 peptide |
3 spectra |
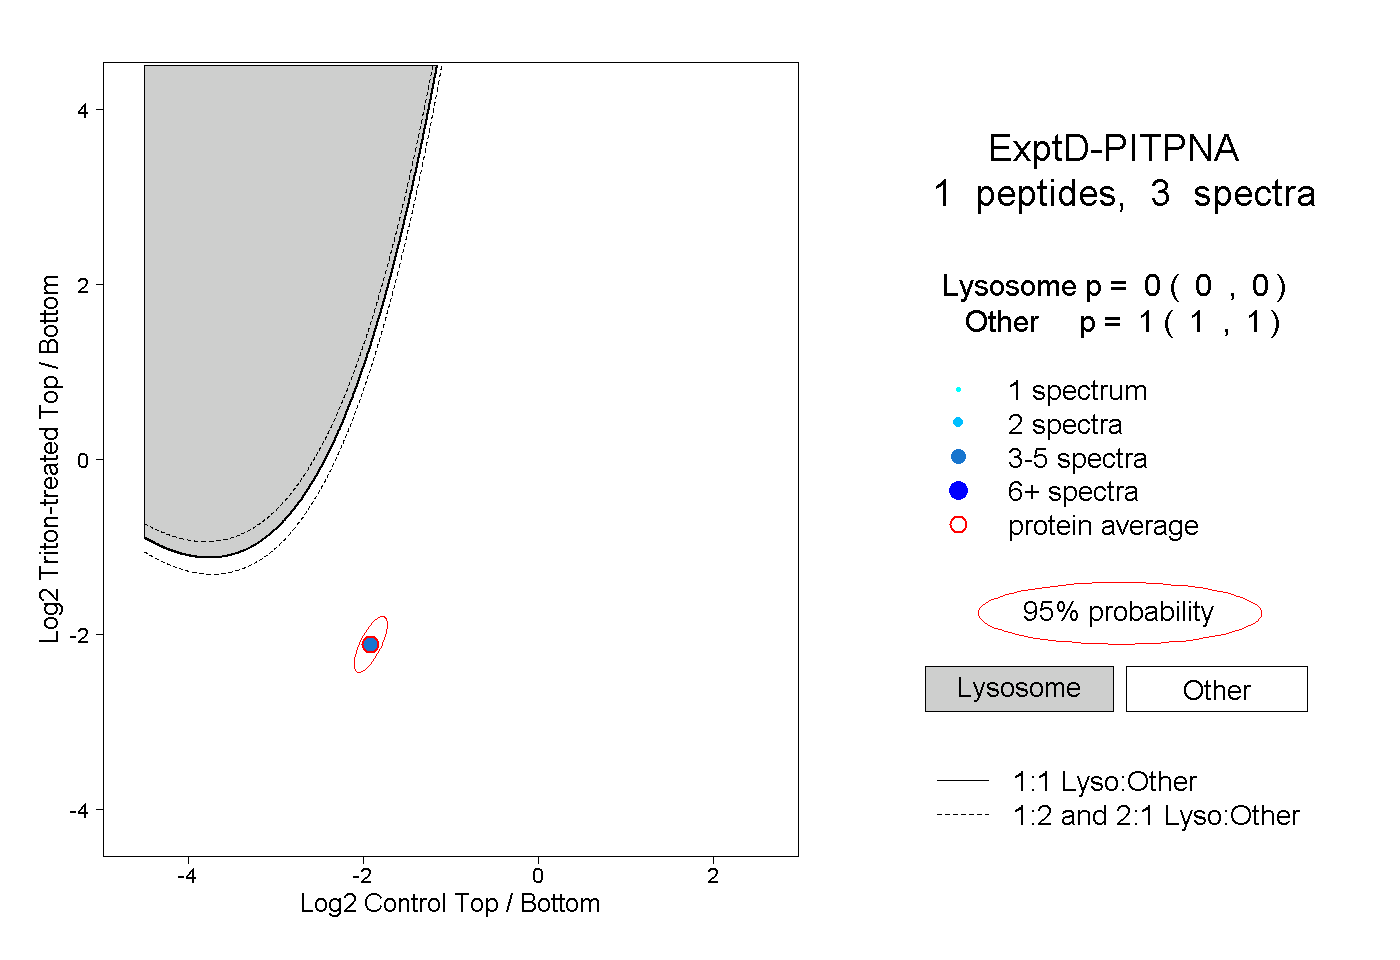 |
0.000 0.000 | 0.000 |
1.000 1.000 | 1.000 |