 5
5peptides
spectra
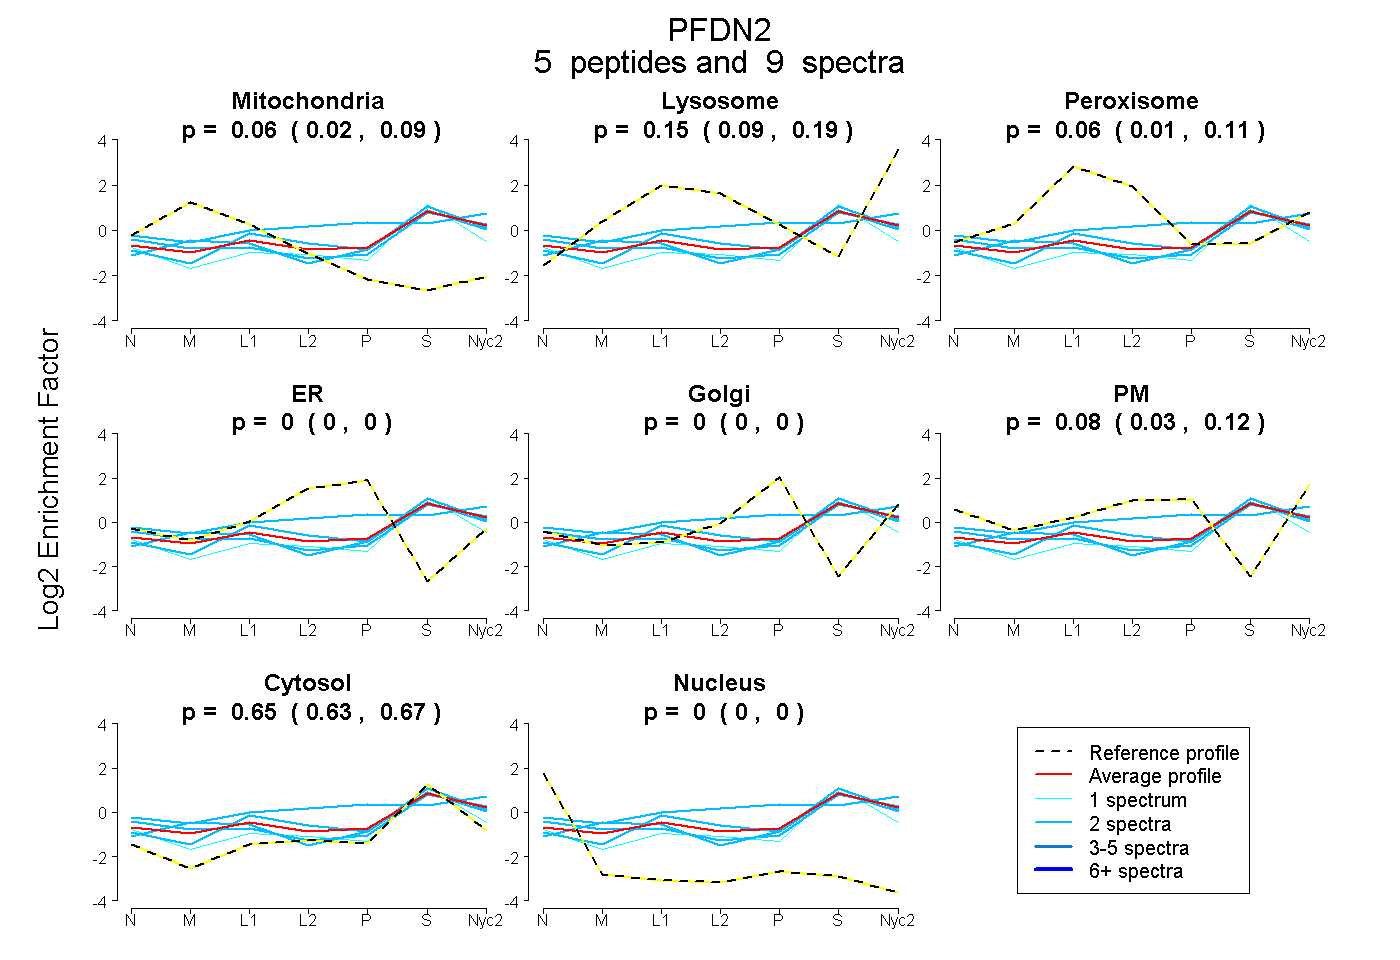
0.018 | 0.090
0.094 | 0.195
0.007 | 0.111
0.000 | 0.000
0.000 | 0.000
0.030 | 0.120
0.625 | 0.671
0.000 | 0.000
1peptide
spectrum
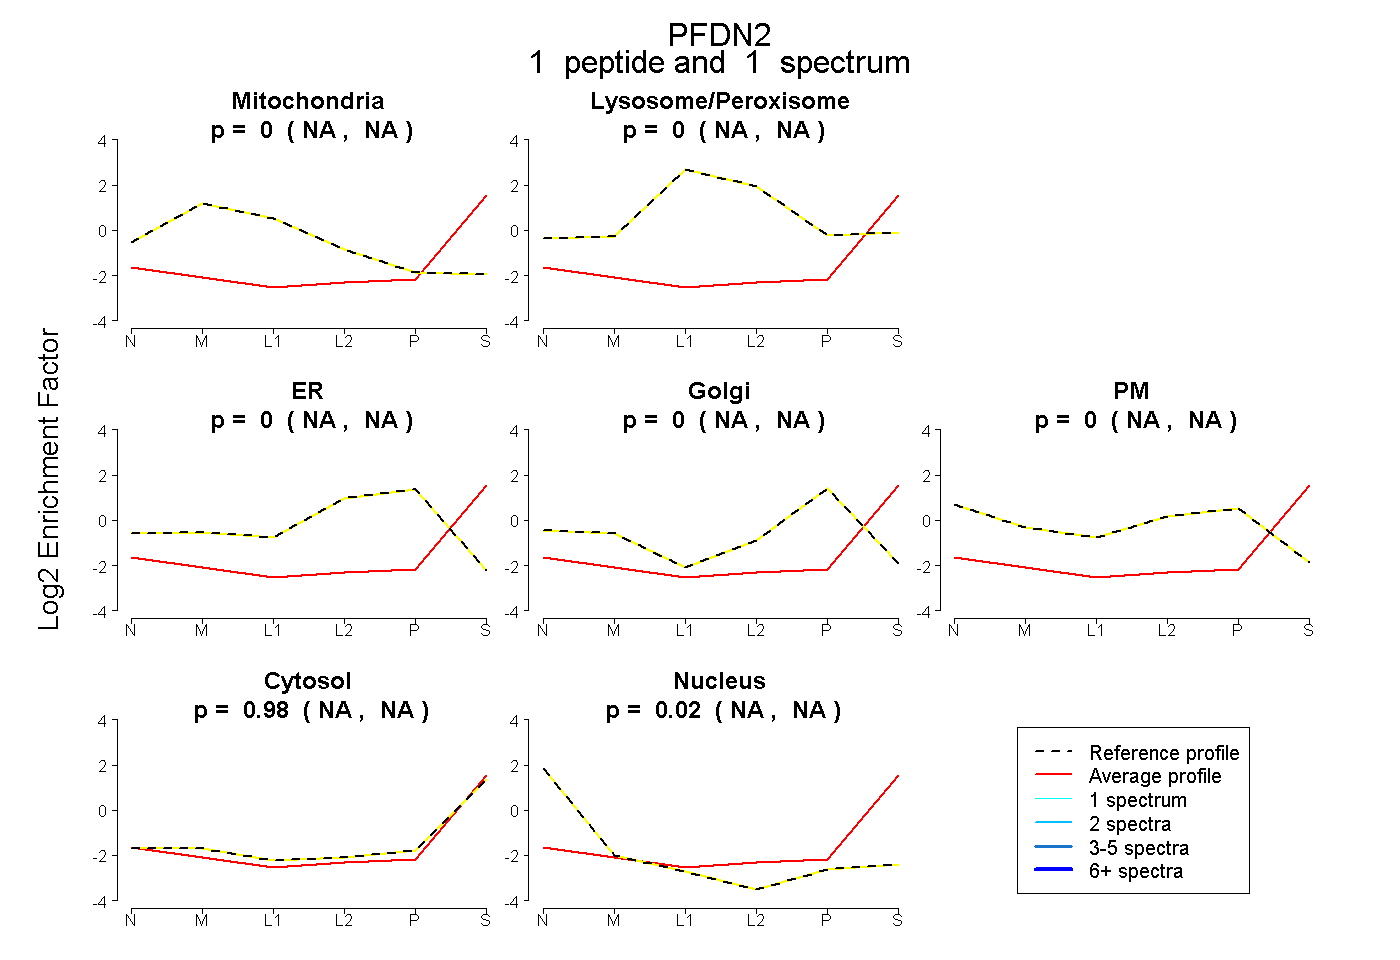
NA | NA
NA | NA
NA | NA
NA | NA
NA | NA
NA | NA
NA | NA
2peptides
spectra
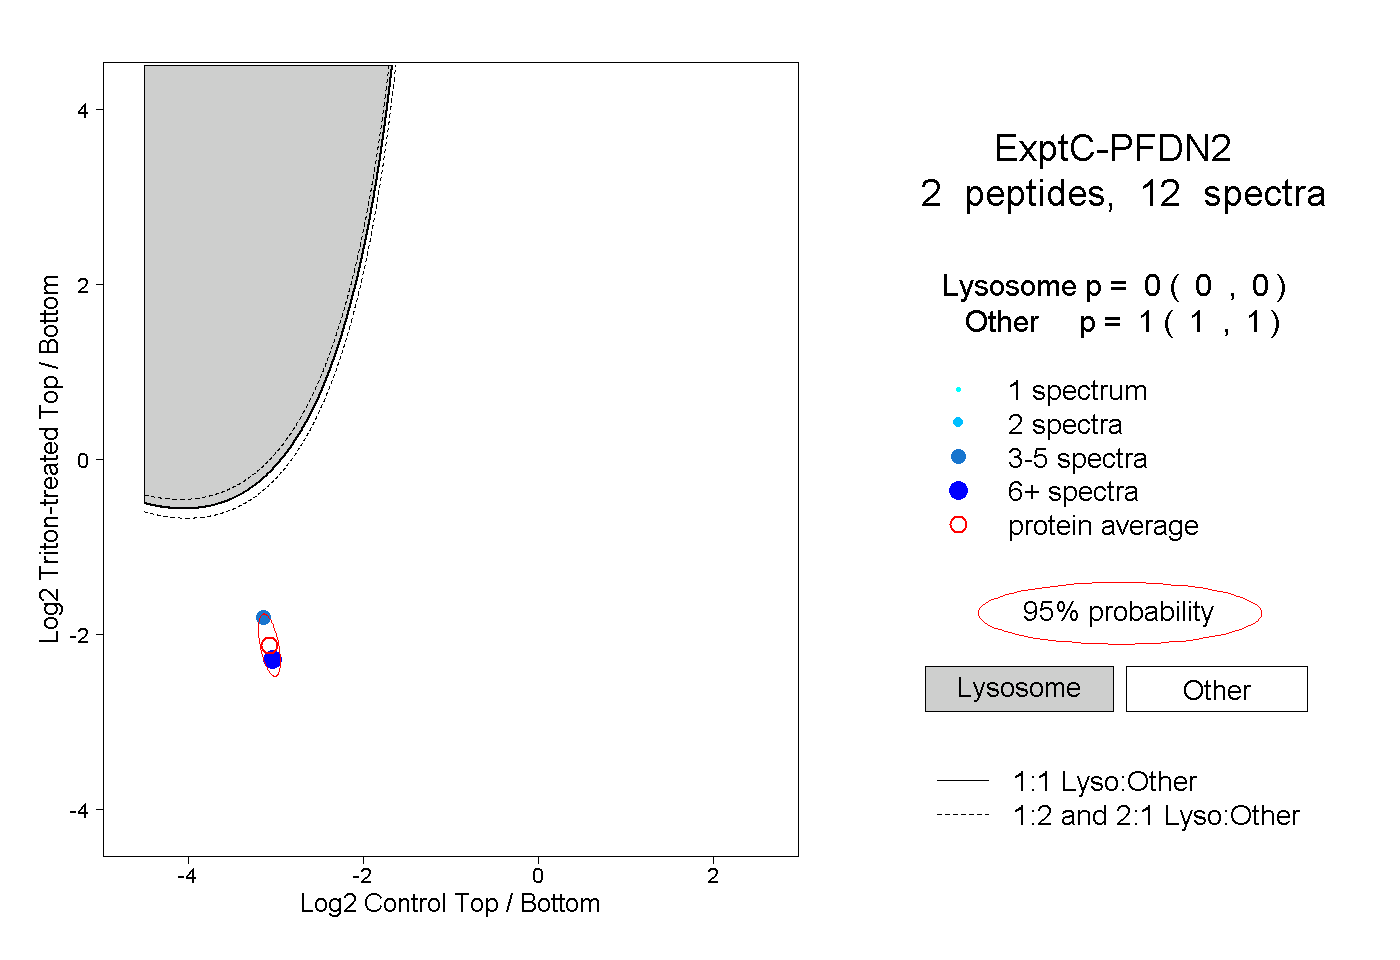
0.000 | 0.000
1.000 | 1.000