 5
5peptides
spectra
0.018 | 0.090
0.094 | 0.195
0.007 | 0.111
0.000 | 0.000
0.000 | 0.000
0.030 | 0.120
0.625 | 0.671
0.000 | 0.000
| Plot | Mito | Lyso | Perox | ER | Golgi | PM | Cytosol | Nucleus | |||||
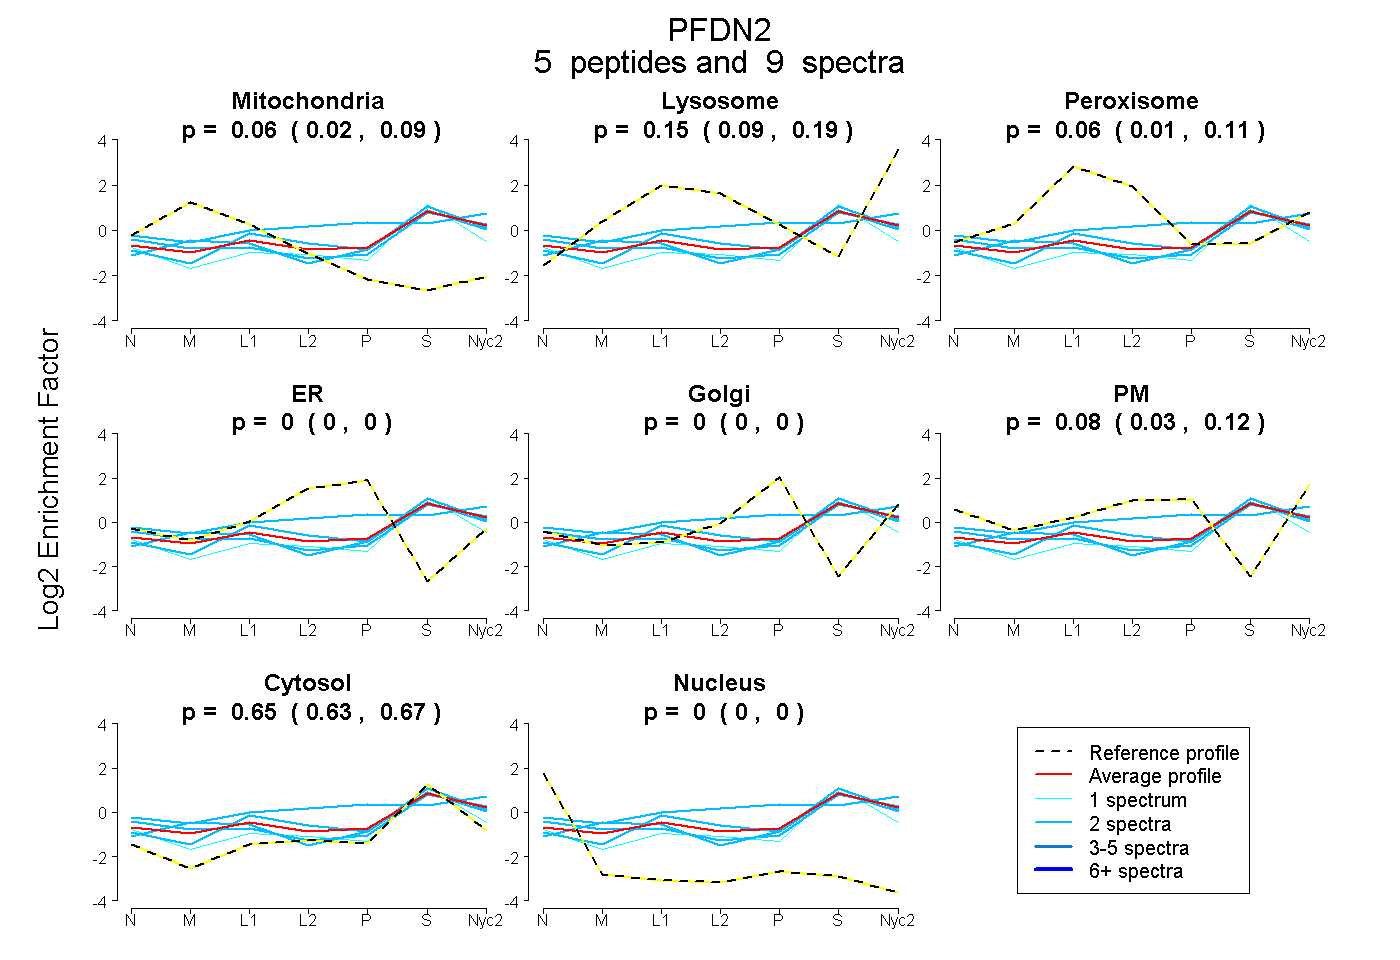
| Expt A |
5 peptides |
9 spectra |
|
0.057 0.018 | 0.090 |
0.148 0.094 | 0.195 |
0.064 0.007 | 0.111 |
0.000 0.000 | 0.000 |
0.000 0.000 | 0.000 |
0.080 0.030 | 0.120 |
0.650 0.625 | 0.671 |
0.000 0.000 | 0.000 |
| 2 spectra, EVLPALEGNK | 0.160 | 0.192 | 0.000 | 0.000 | 0.000 | 0.000 | 0.648 | 0.000 | ||
| 2 spectra, ENSEGAGAK | 0.000 | 0.089 | 0.185 | 0.000 | 0.056 | 0.278 | 0.392 | 0.000 | ||
| 2 spectra, IIETLSQQLQAK | 0.127 | 0.143 | 0.000 | 0.000 | 0.000 | 0.076 | 0.654 | 0.000 | ||
| 2 spectra, ELNEFR | 0.000 | 0.117 | 0.192 | 0.000 | 0.000 | 0.000 | 0.692 | 0.000 | ||
| 1 spectrum, AAELEMELNEHSLVIDTLK | 0.051 | 0.000 | 0.094 | 0.000 | 0.000 | 0.036 | 0.819 | 0.000 |
| Plot | Mito | Lyso or Perox | ER | Golgi | PM | Cytosol | Nucleus | ||||||
| Expt B |
1 peptide |
1 spectrum |
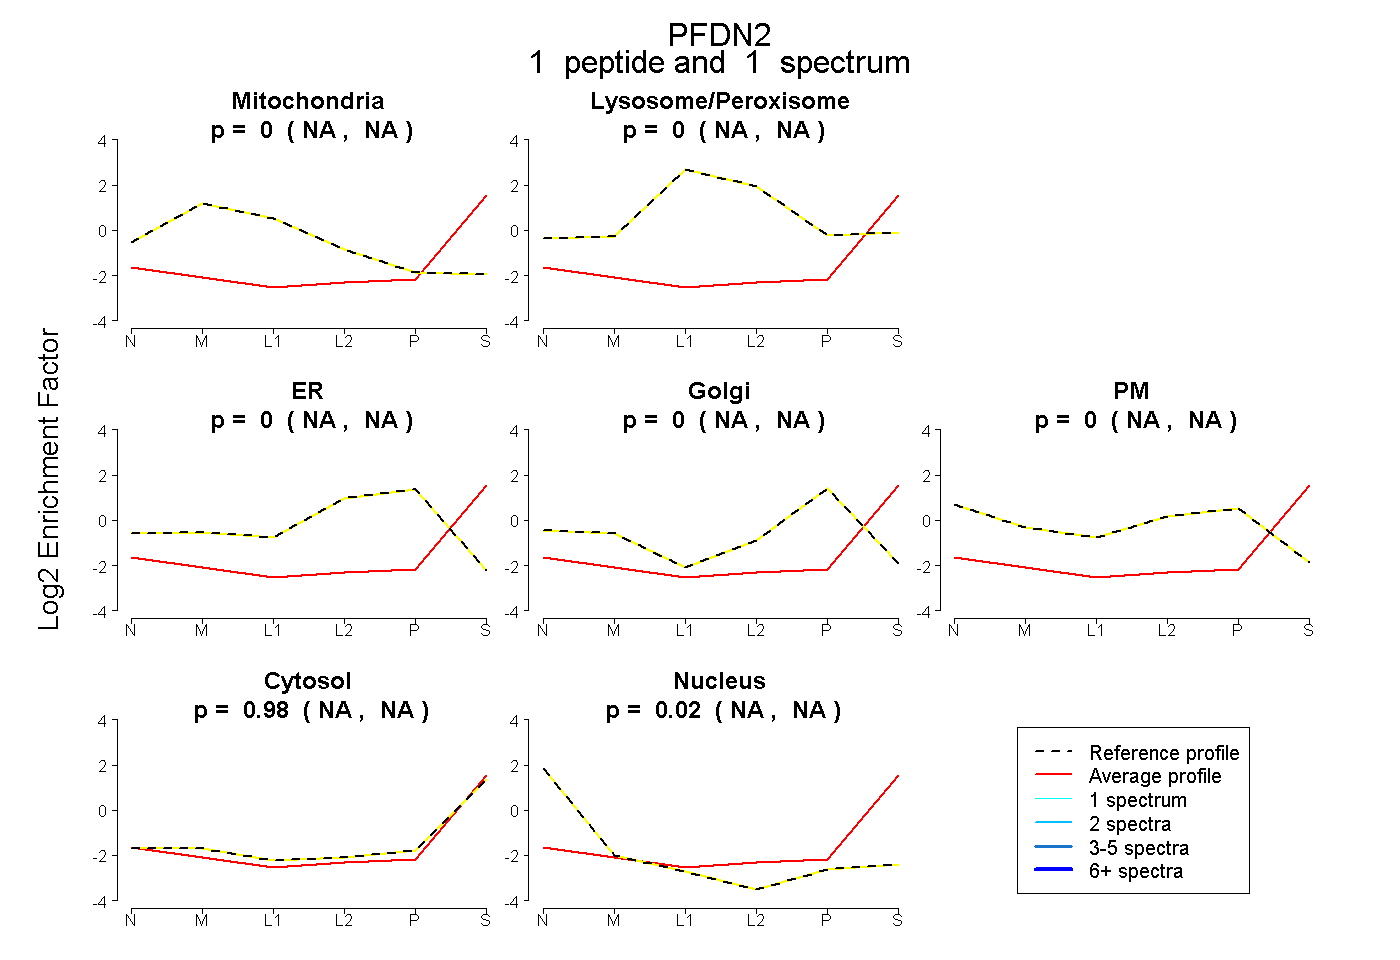 |
0.000 NA | NA |
0.000 NA | NA |
0.000 NA | NA |
0.000 NA | NA |
0.000 NA | NA |
0.982 NA | NA |
0.018 NA | NA |
|||
| Plot | Lyso | Other | |||||||||||
| Expt C |
2 peptides |
12 spectra |
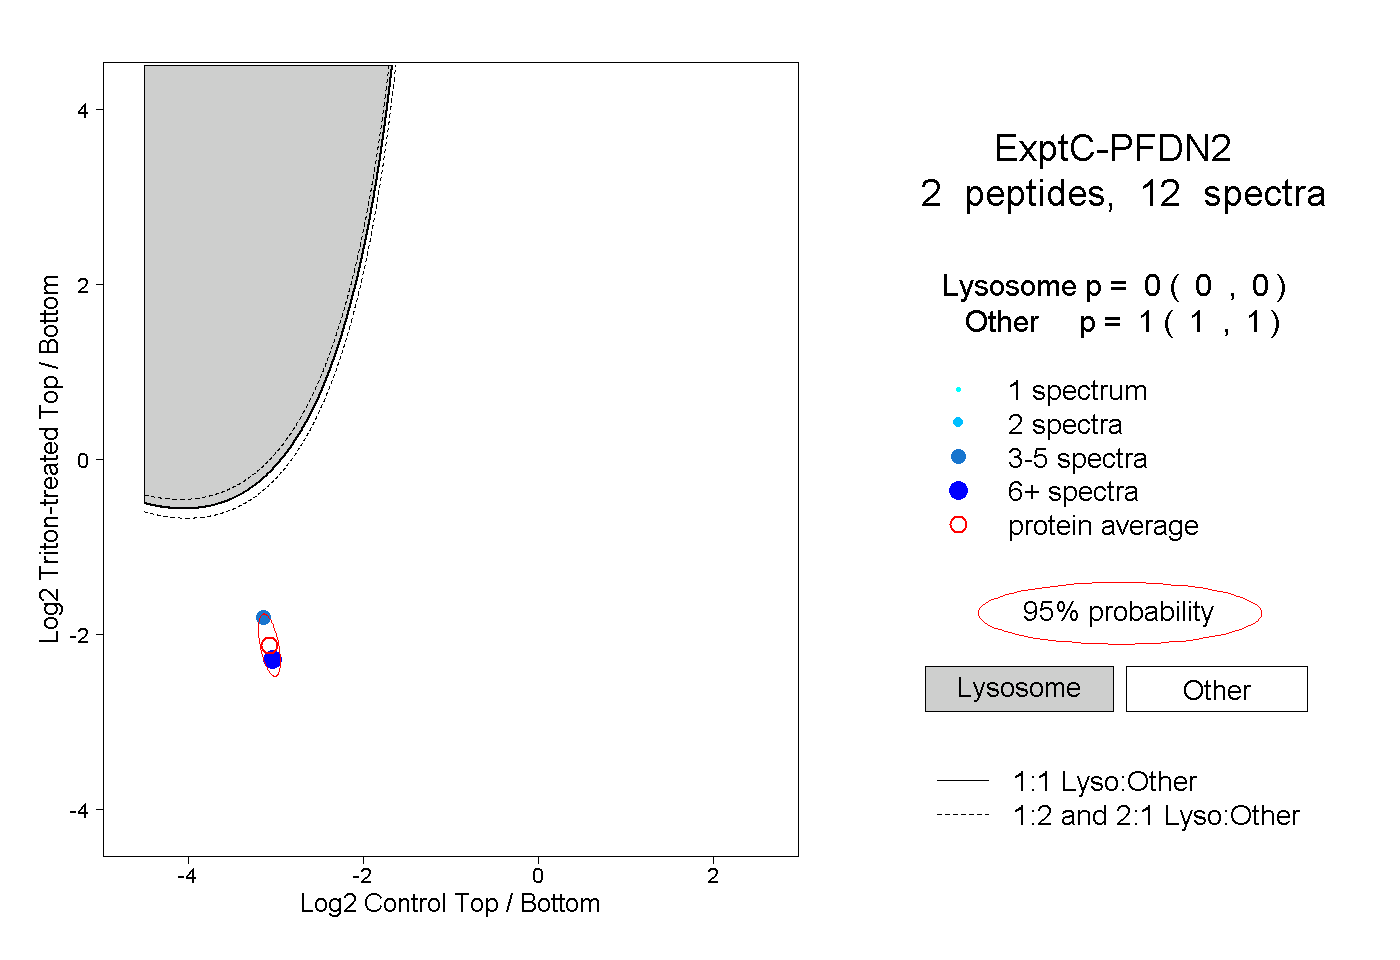 |
0.000 0.000 | 0.000 |
1.000 1.000 | 1.000 |