 11
11peptides
spectra
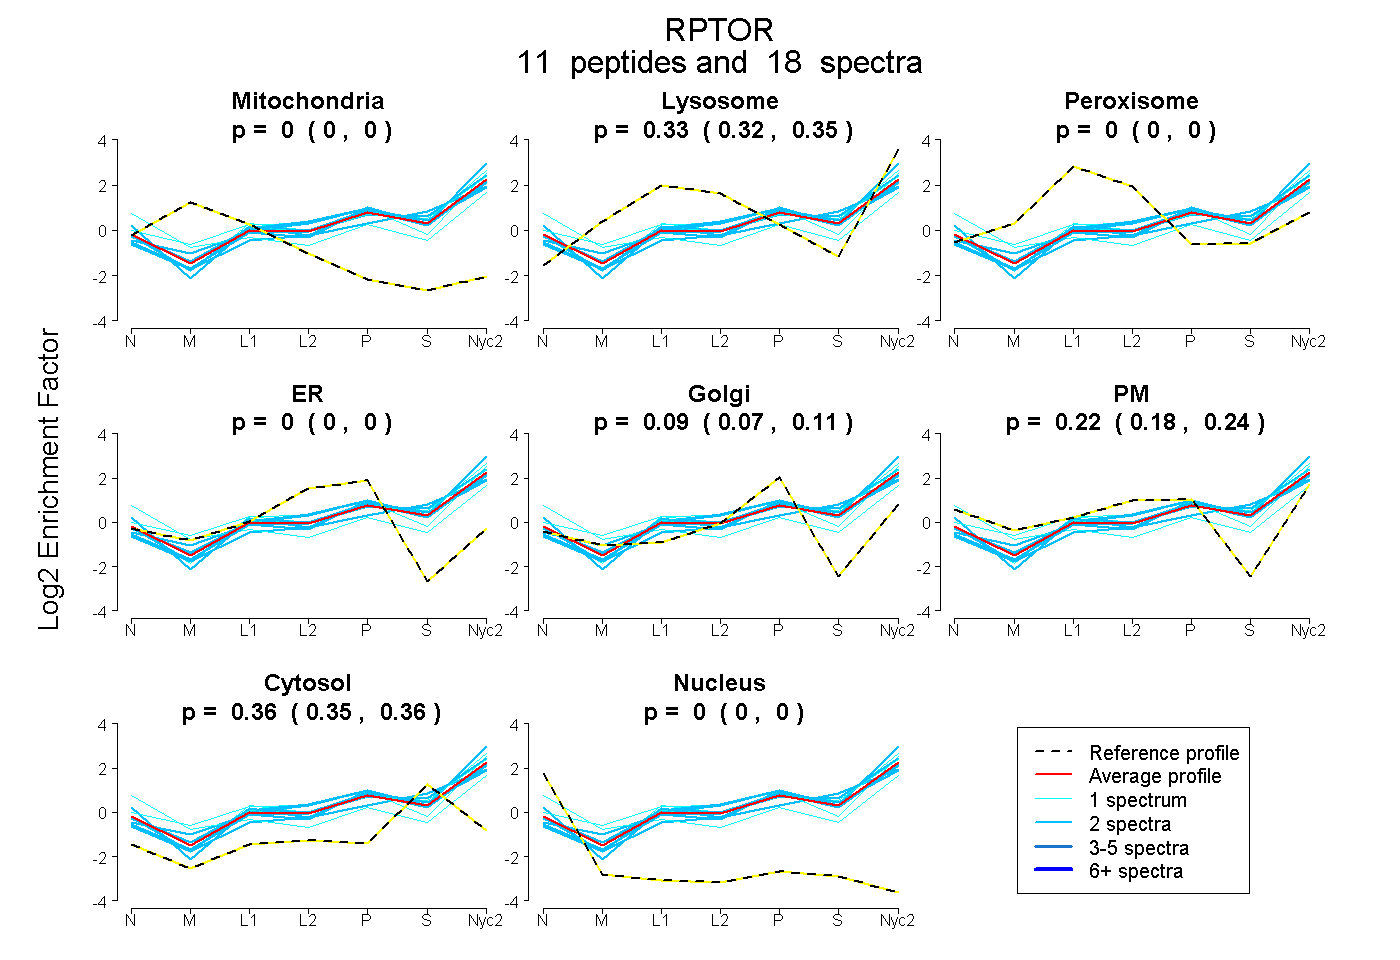
0.000 | 0.000
0.319 | 0.346
0.000 | 0.000
0.000 | 0.000
0.068 | 0.115
0.181 | 0.243
0.349 | 0.364
0.000 | 0.000
3peptides
spectra
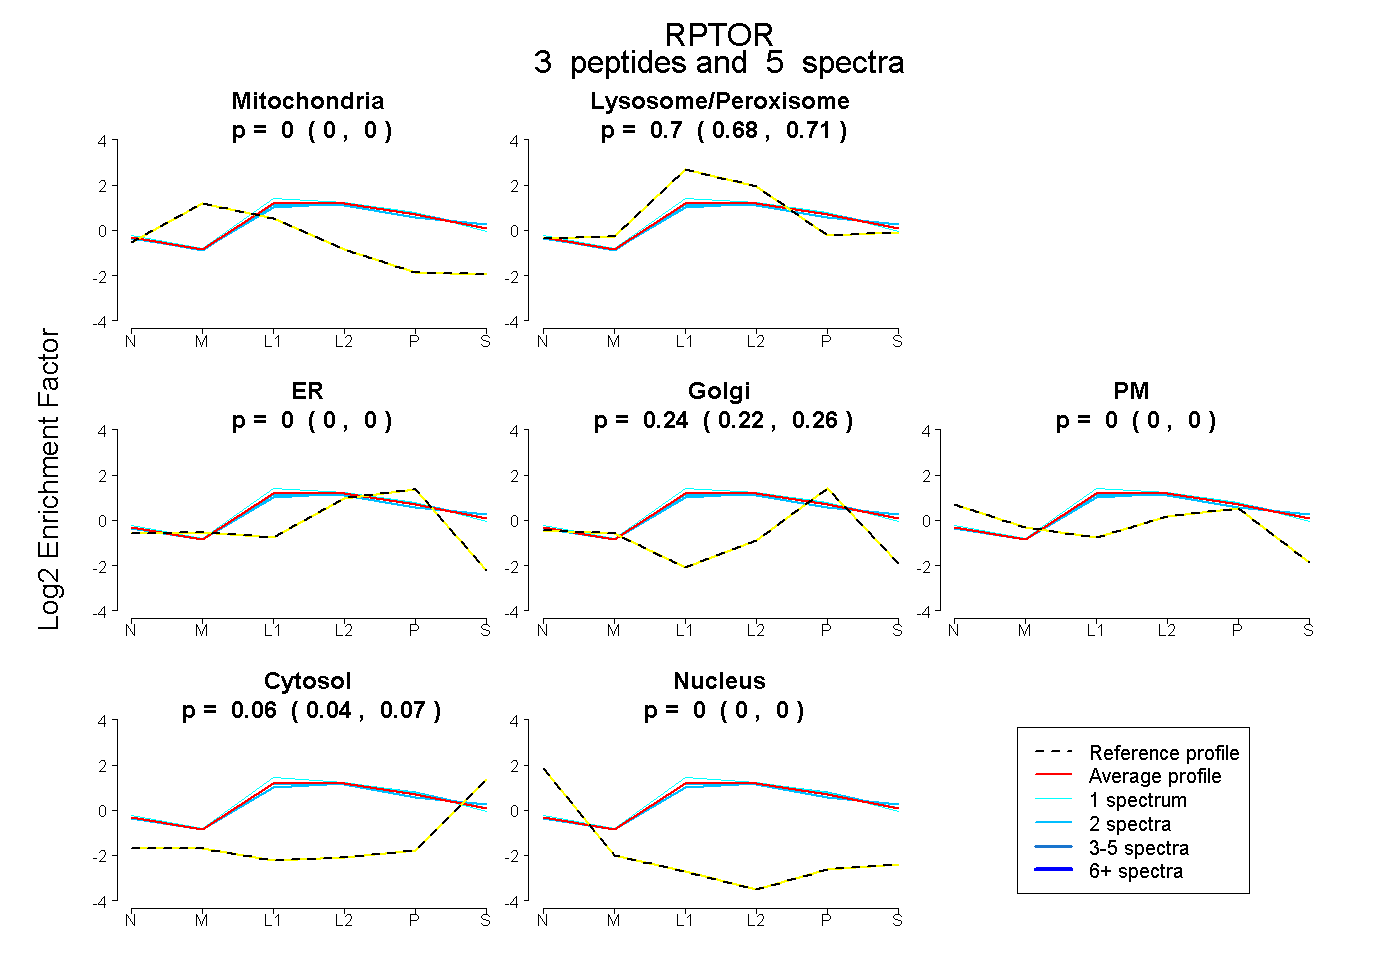
0.000 | 0.000
0.683 | 0.711
0.000 | 0.000
0.224 | 0.258
0.000 | 0.000
0.044 | 0.069
0.000 | 0.000
19peptides
spectra
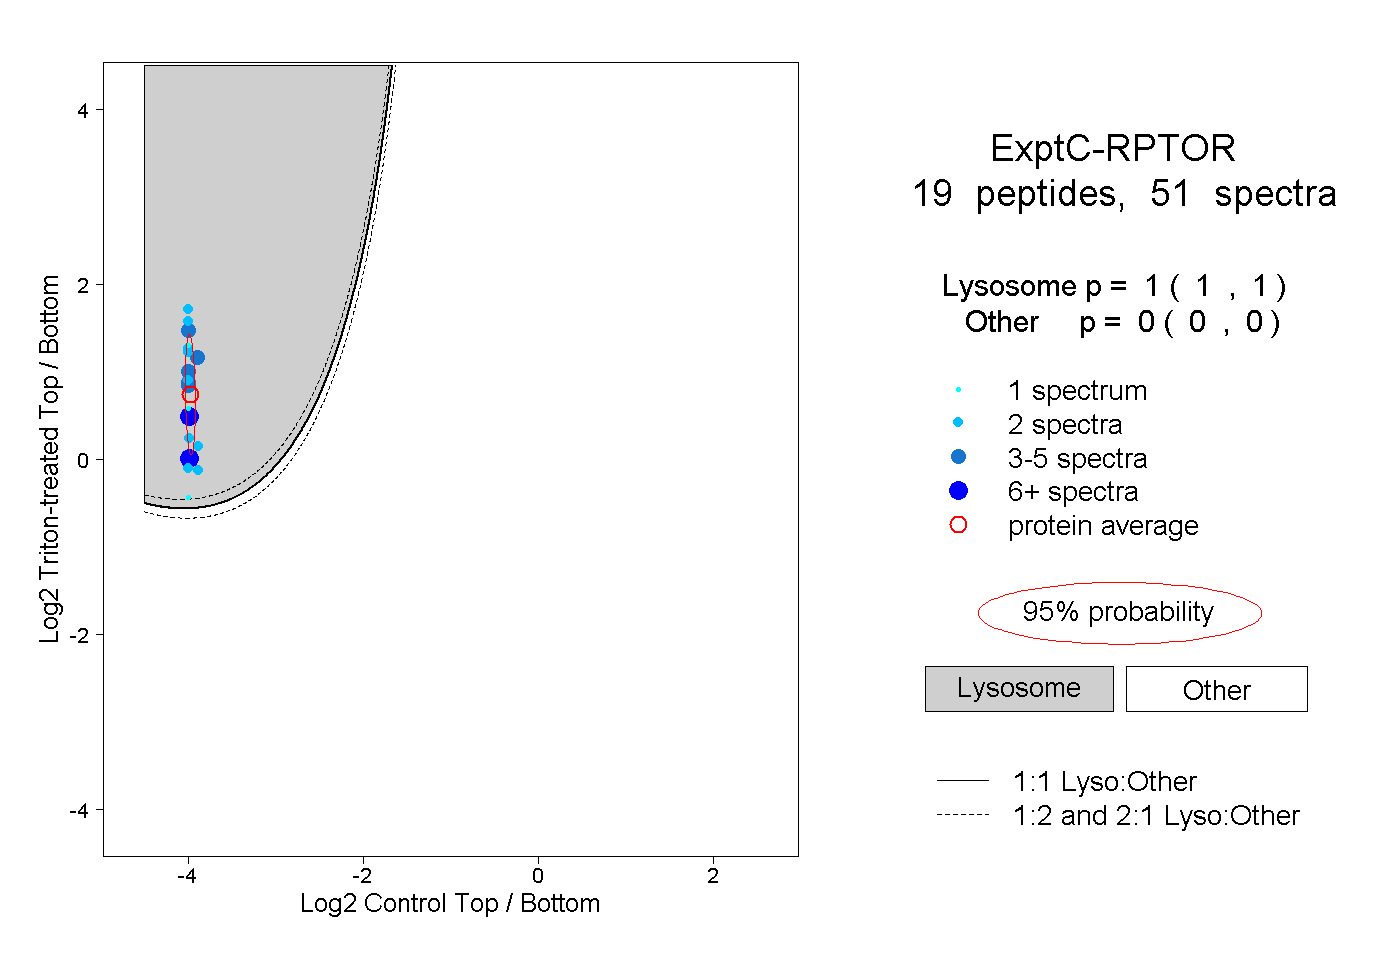
1.000 | 1.000
0.000 | 0.000
4peptides
spectra
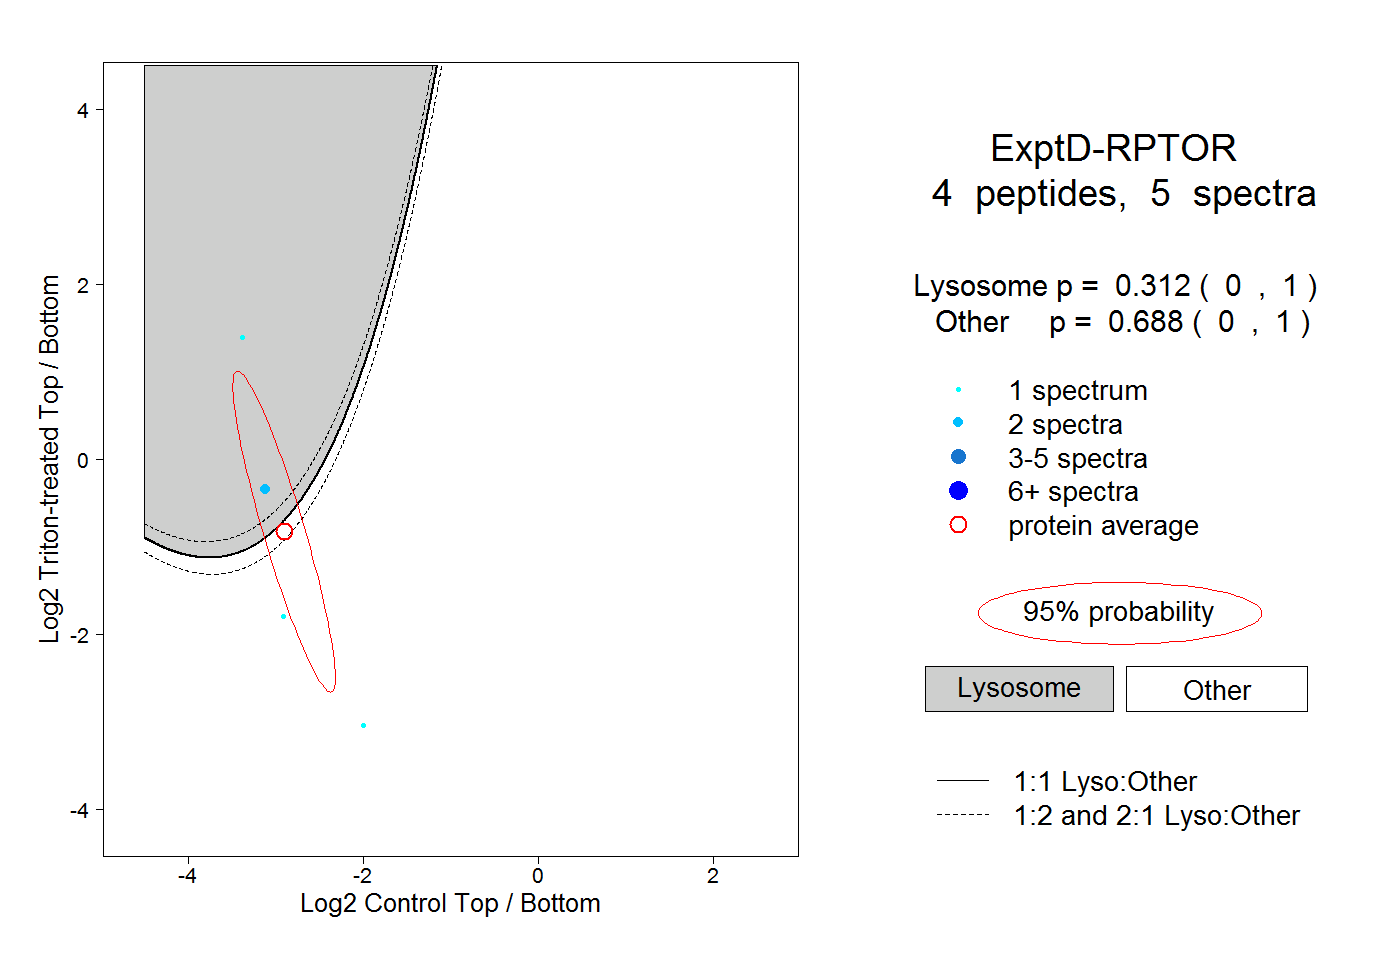
0.000 | 1.000
0.000 | 1.000