 11
11peptides
spectra
0.000 | 0.000
0.319 | 0.346
0.000 | 0.000
0.000 | 0.000
0.068 | 0.115
0.181 | 0.243
0.349 | 0.364
0.000 | 0.000
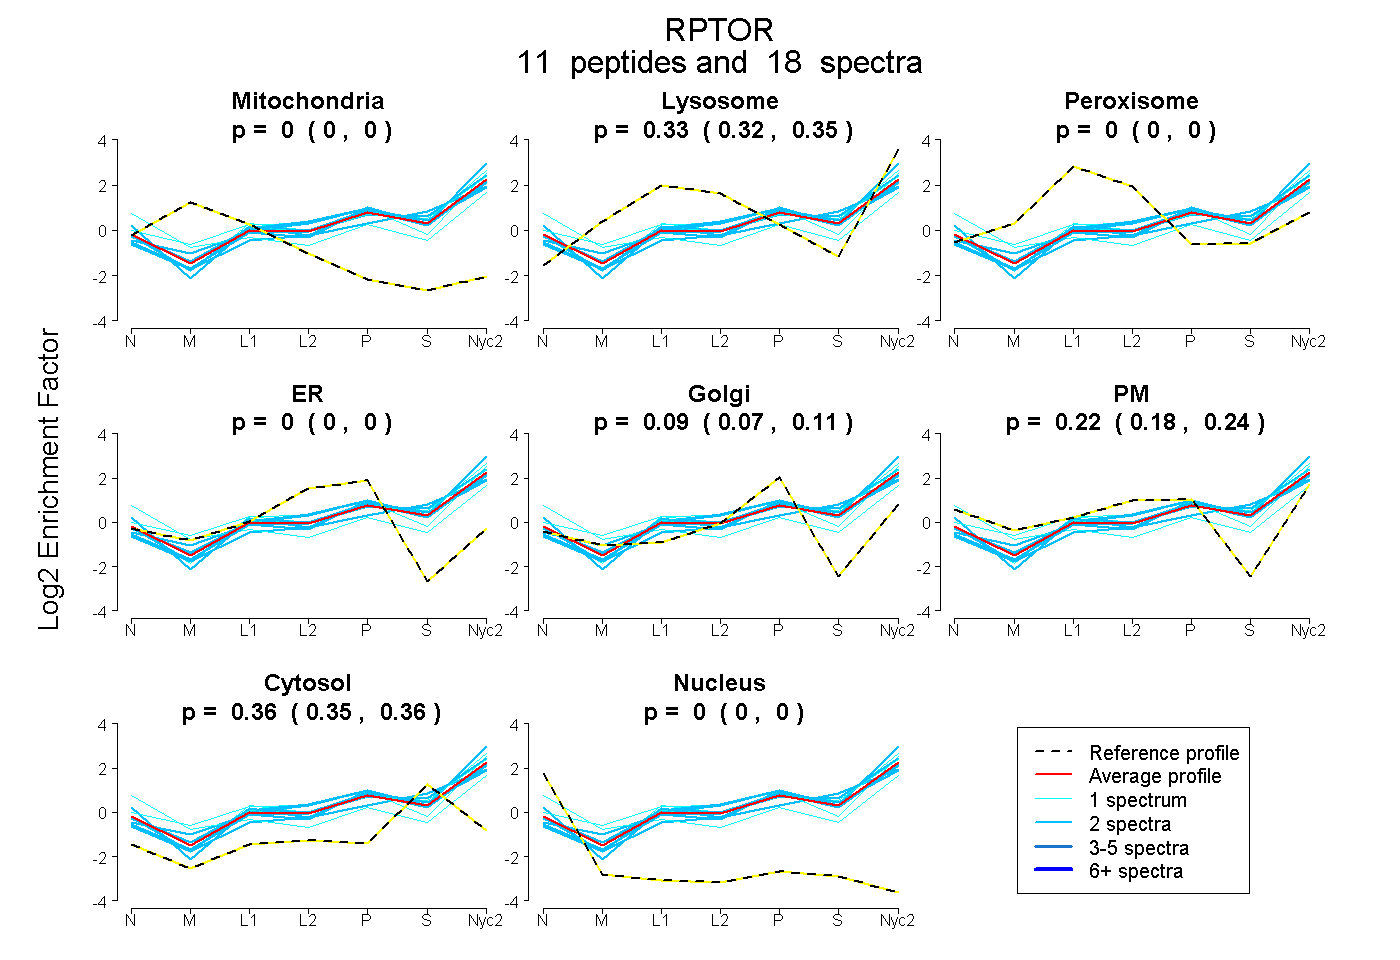
| Plot | Mito | Lyso | Perox | ER | Golgi | PM | Cytosol | Nucleus | |||||
| Expt A |
11 peptides |
18 spectra |
|
0.000 0.000 | 0.000 |
0.334 0.319 | 0.346 |
0.000 0.000 | 0.000 |
0.000 0.000 | 0.000 |
0.093 0.068 | 0.115 |
0.216 0.181 | 0.243 |
0.357 0.349 | 0.364 |
0.000 0.000 | 0.000 |
| 1 spectrum, SLIVAGLGDGSIR | 0.000 | 0.363 | 0.000 | 0.000 | 0.052 | 0.192 | 0.393 | 0.000 | ||
| 1 spectrum, NFLLAER | 0.000 | 0.030 | 0.000 | 0.000 | 0.000 | 0.629 | 0.341 | 0.000 | ||
| 1 spectrum, ALDLLGR | 0.000 | 0.429 | 0.000 | 0.000 | 0.124 | 0.106 | 0.341 | 0.000 | ||
| 2 spectra, SLAQSWR | 0.000 | 0.435 | 0.000 | 0.000 | 0.168 | 0.000 | 0.397 | 0.000 | ||
| 2 spectra, QFALQR | 0.000 | 0.353 | 0.000 | 0.000 | 0.116 | 0.213 | 0.317 | 0.000 | ||
| 2 spectra, SYNCTPVSSPR | 0.000 | 0.316 | 0.000 | 0.000 | 0.166 | 0.127 | 0.392 | 0.000 | ||
| 1 spectrum, LYSLLSDPIPEVR | 0.000 | 0.374 | 0.000 | 0.000 | 0.039 | 0.369 | 0.218 | 0.000 | ||
| 2 spectra, QDLLVASLFR | 0.000 | 0.469 | 0.000 | 0.000 | 0.157 | 0.099 | 0.275 | 0.000 | ||
| 2 spectra, IPEEHDLESQIR | 0.000 | 0.388 | 0.000 | 0.000 | 0.292 | 0.000 | 0.321 | 0.000 | ||
| 2 spectra, LLQSSAR | 0.000 | 0.356 | 0.000 | 0.000 | 0.110 | 0.025 | 0.509 | 0.000 | ||
| 2 spectra, ATVNARPQR | 0.000 | 0.211 | 0.000 | 0.000 | 0.000 | 0.414 | 0.376 | 0.000 |
| Plot | Mito | Lyso or Perox | ER | Golgi | PM | Cytosol | Nucleus | ||||||
| Expt B |
3 peptides |
5 spectra |
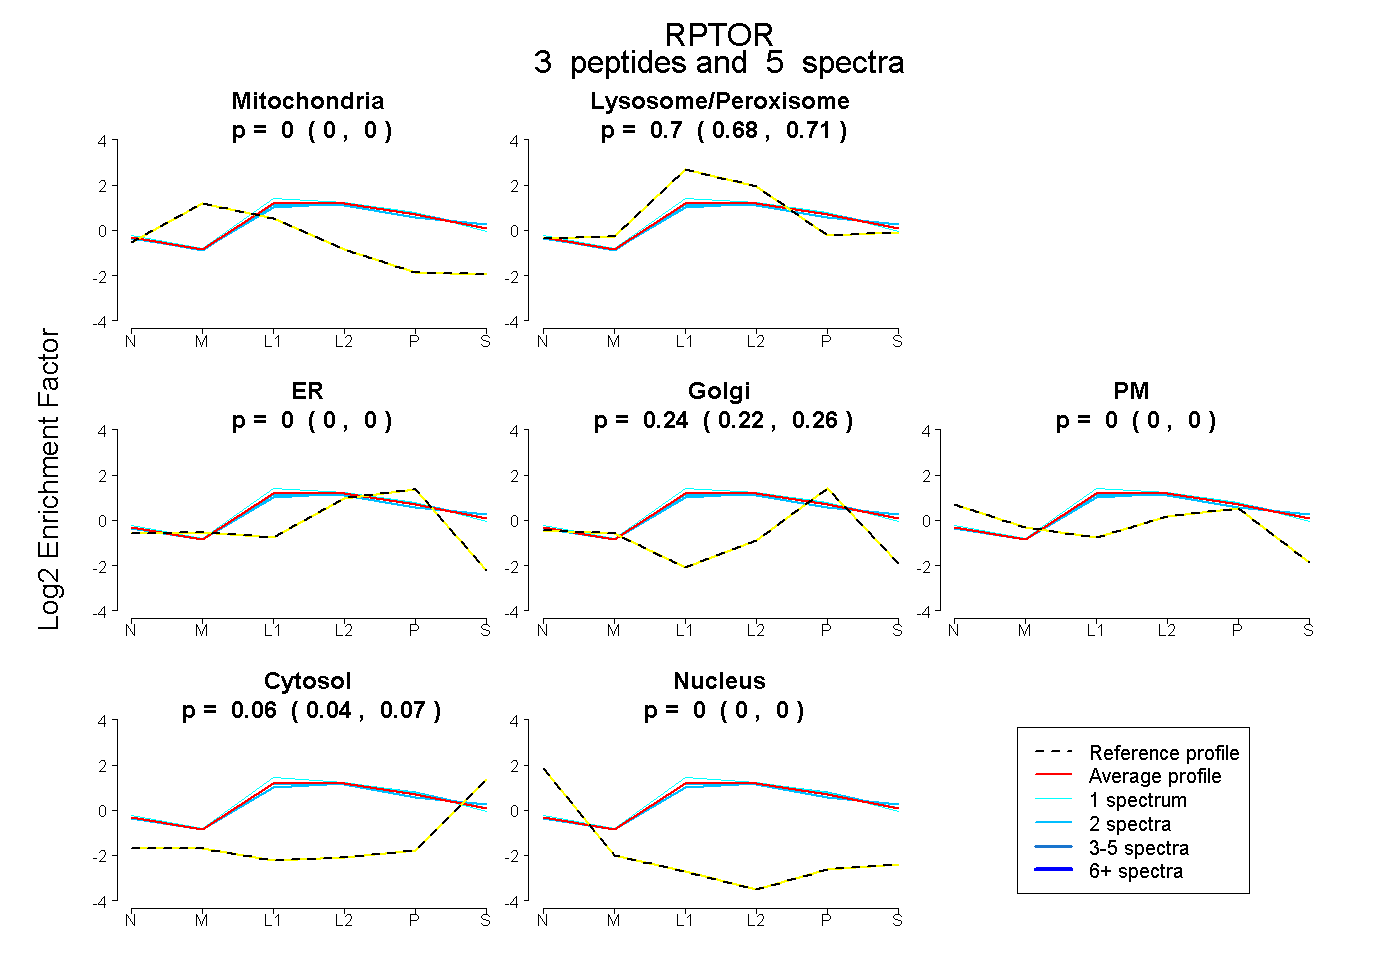 |
0.000 0.000 | 0.000 |
0.699 0.683 | 0.711 |
0.000 0.000 | 0.000 |
0.243 0.224 | 0.258 |
0.000 0.000 | 0.000 |
0.058 0.044 | 0.069 |
0.000 0.000 | 0.000 |
|||
| Plot | Lyso | Other | |||||||||||
| Expt C |
19 peptides |
51 spectra |
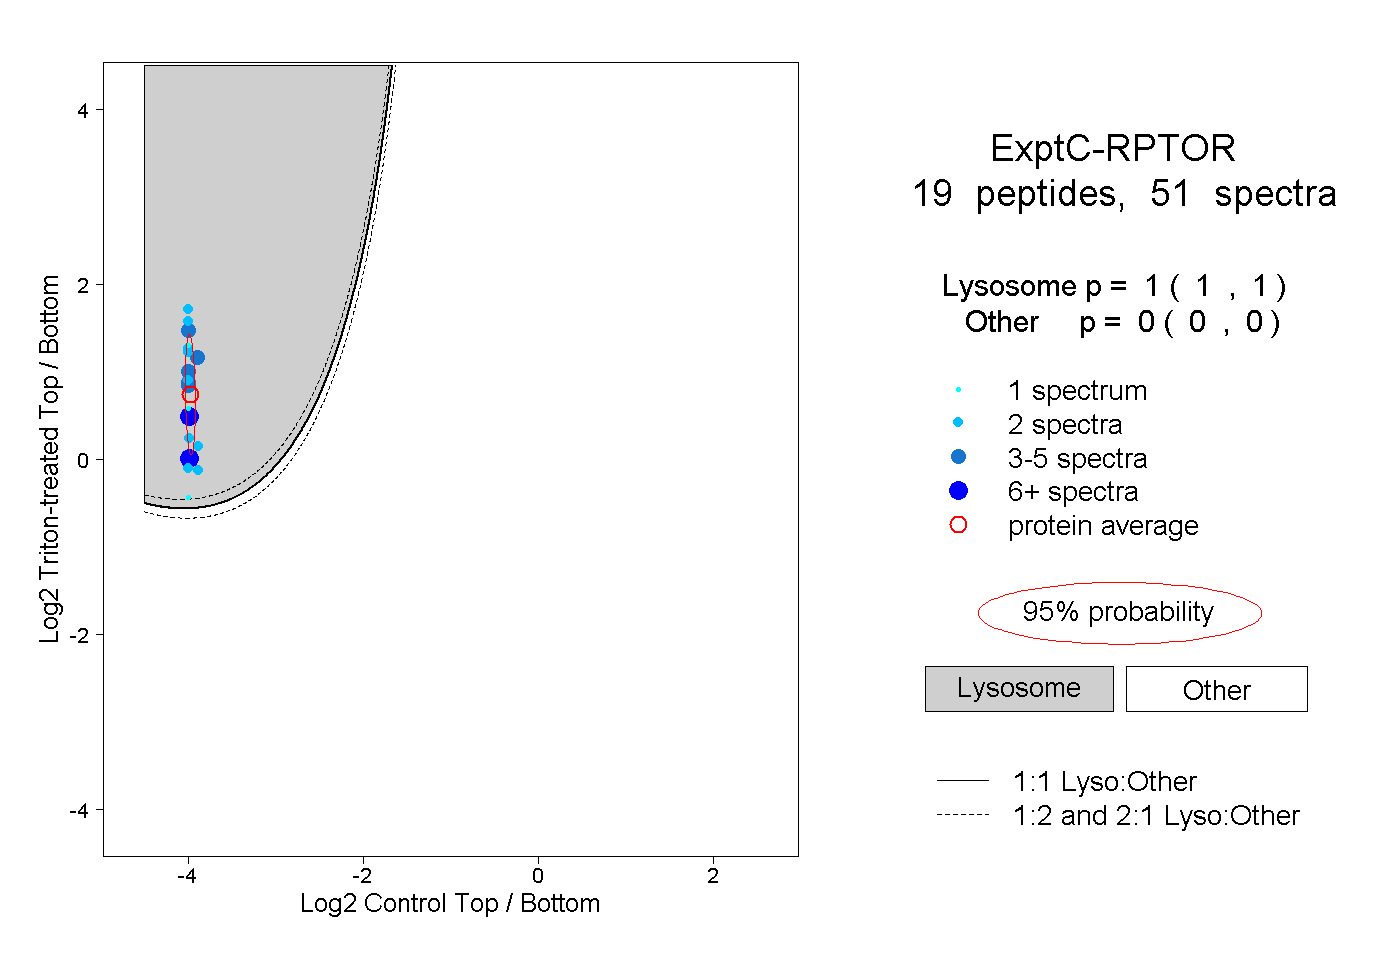 |
1.000 1.000 | 1.000 |
0.000 0.000 | 0.000 |
||||||||
| Plot | Lyso | Other | |||||||||||
| Expt D |
4 peptides |
5 spectra |
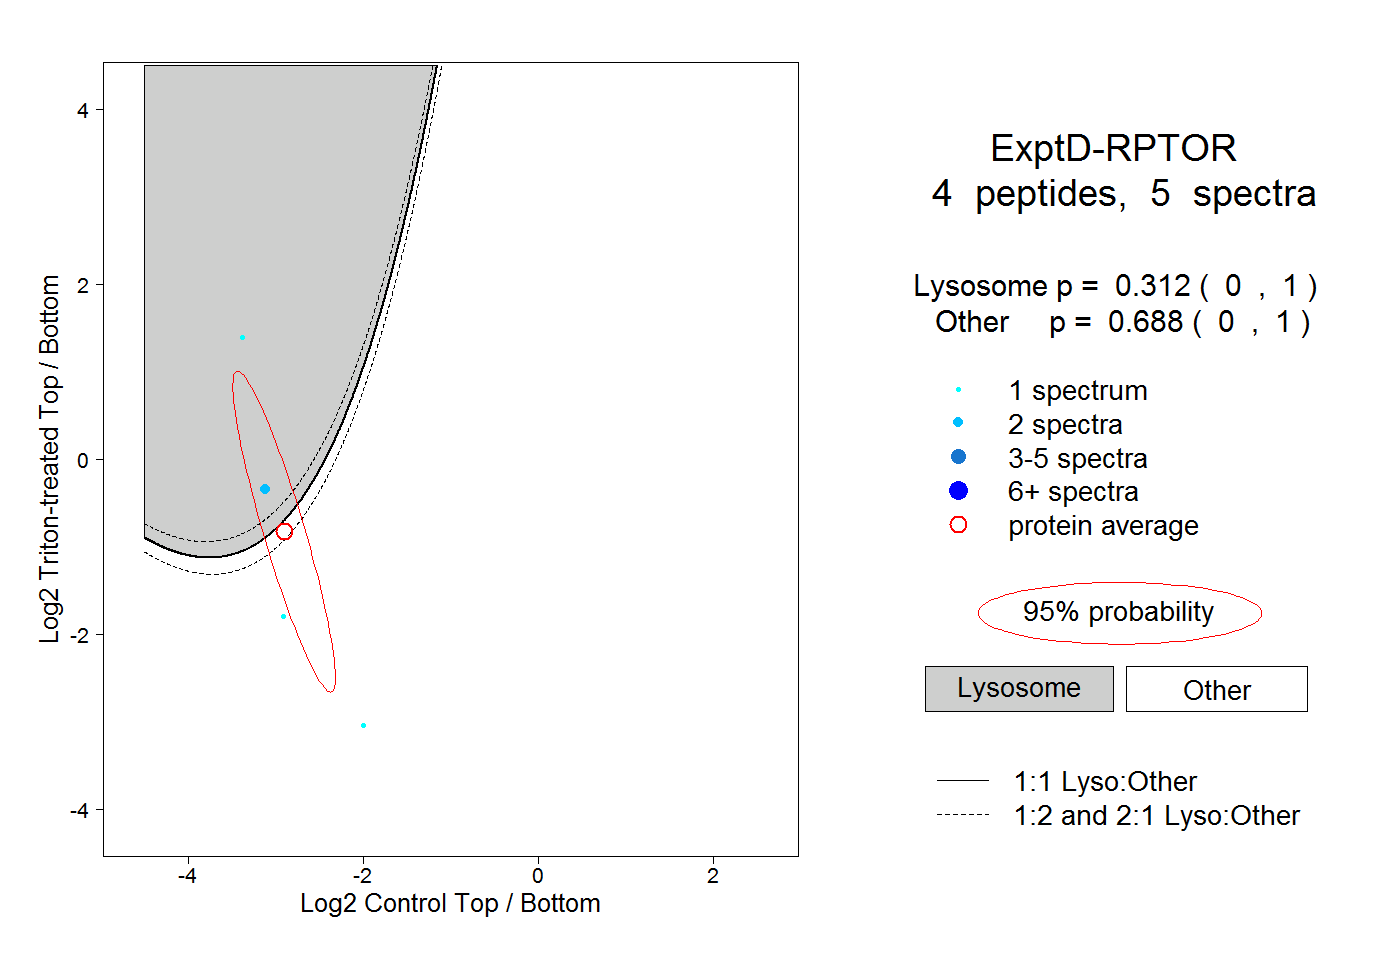 |
0.312 0.000 | 1.000 |
0.688 0.000 | 1.000 |