 21
21peptides
spectra
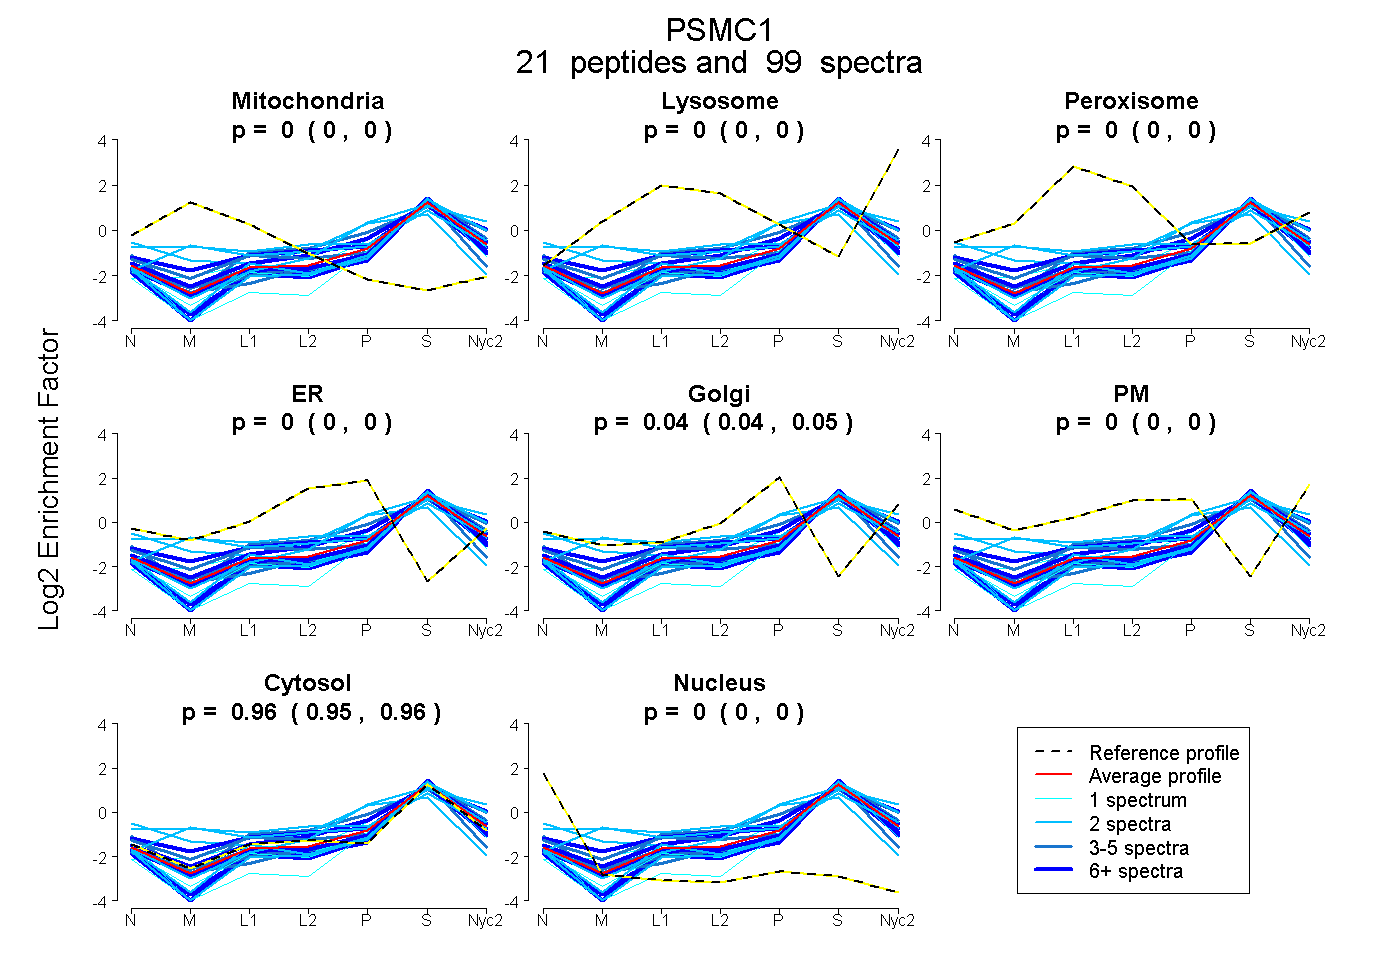
0.000 | 0.000
0.000 | 0.000
0.000 | 0.000
0.000 | 0.000
0.039 | 0.045
0.000 | 0.000
0.954 | 0.961
0.000 | 0.000
11peptides
spectra
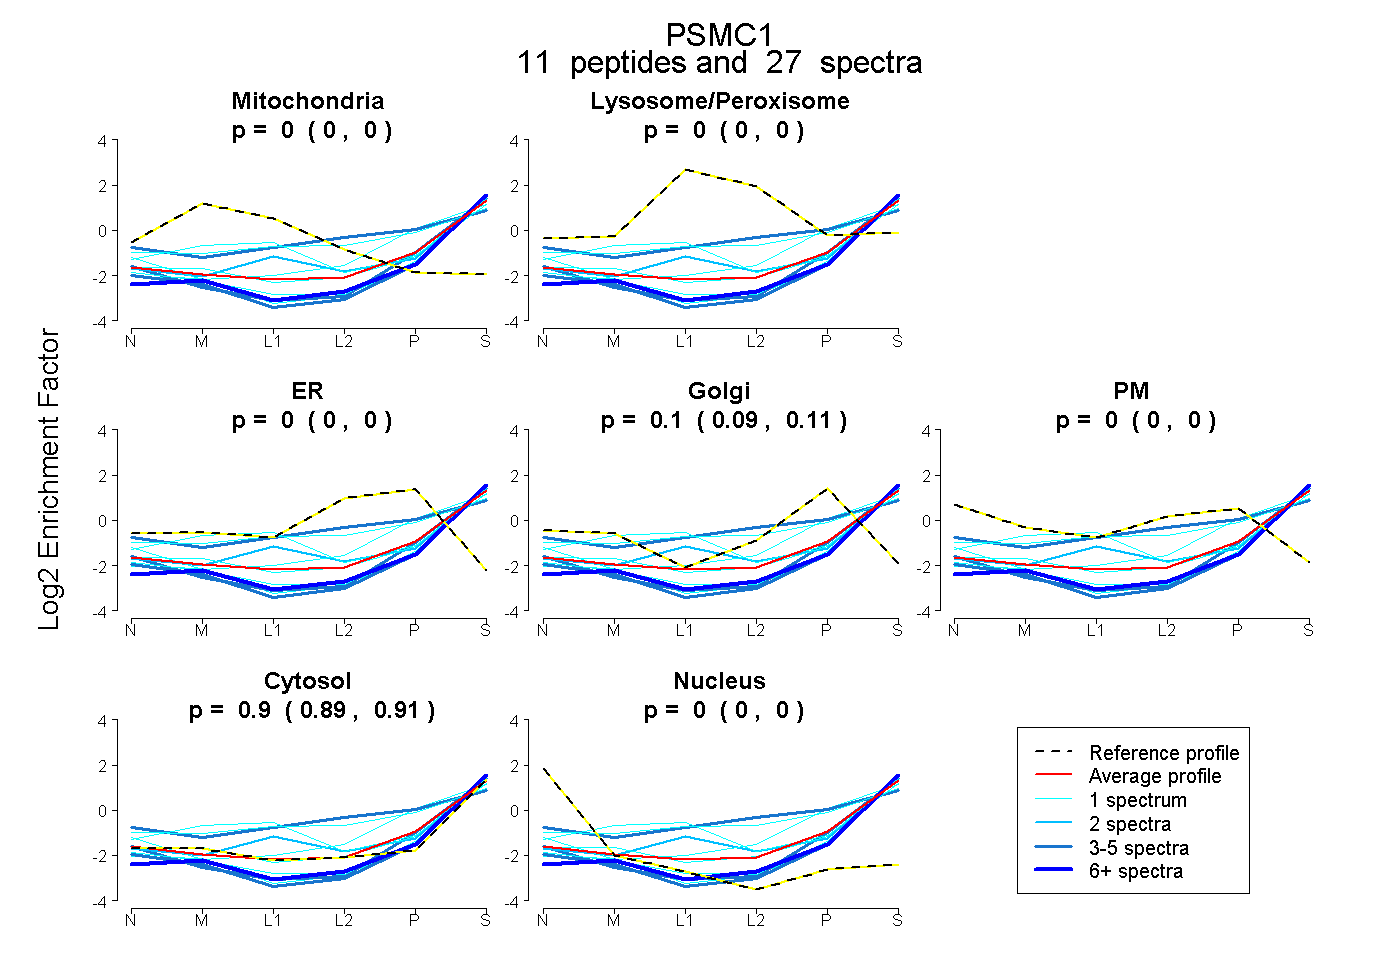
0.000 | 0.000
0.000 | 0.002
0.000 | 0.000
0.088 | 0.109
0.000 | 0.000
0.888 | 0.910
0.000 | 0.000
11peptides
spectra
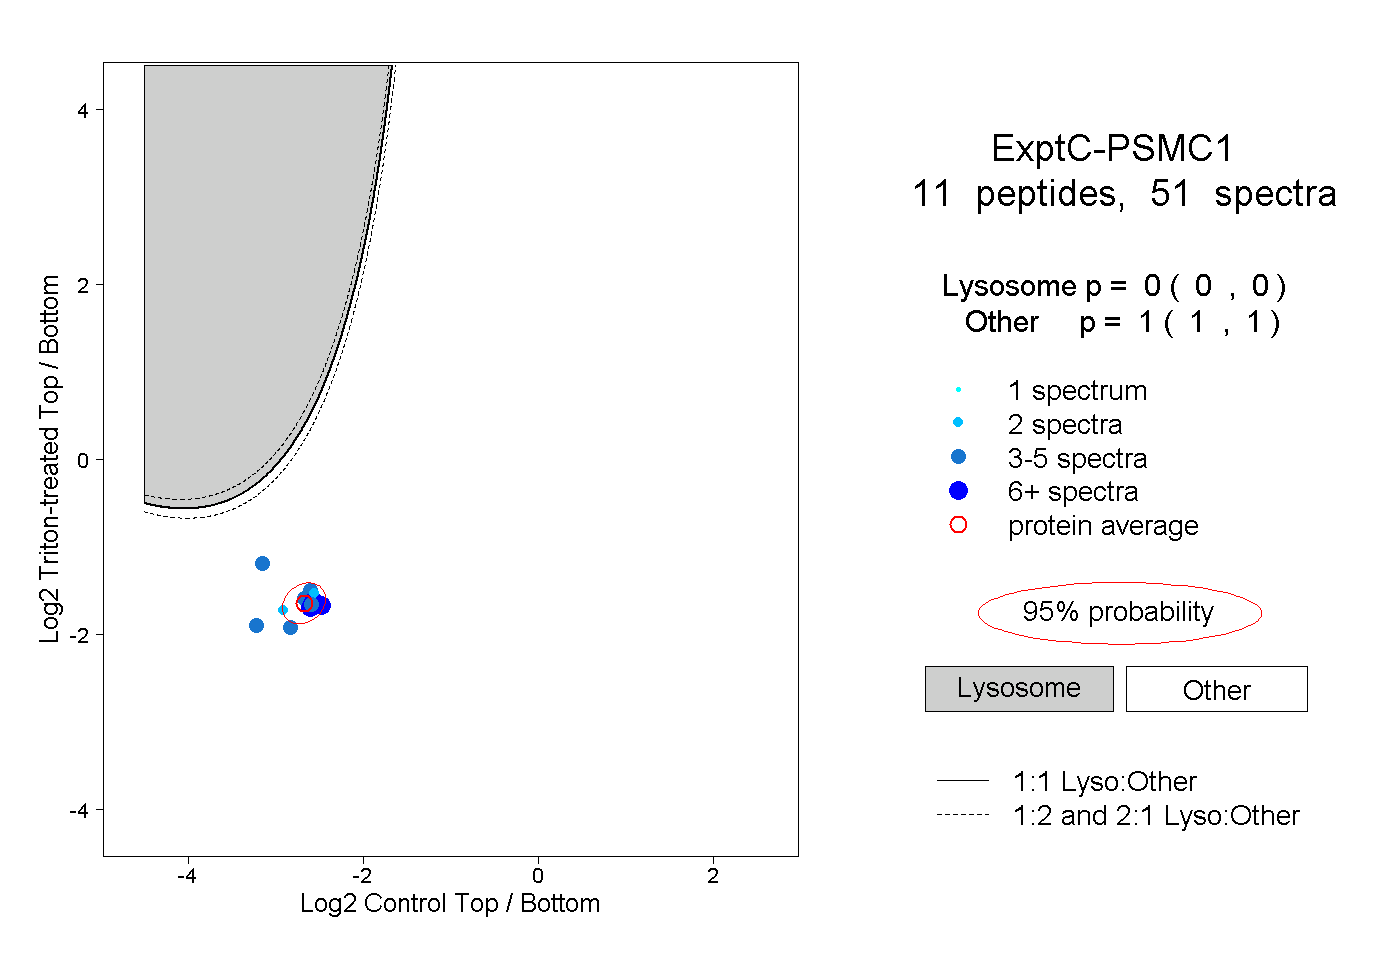
0.000 | 0.000
1.000 | 1.000
3peptides
spectra
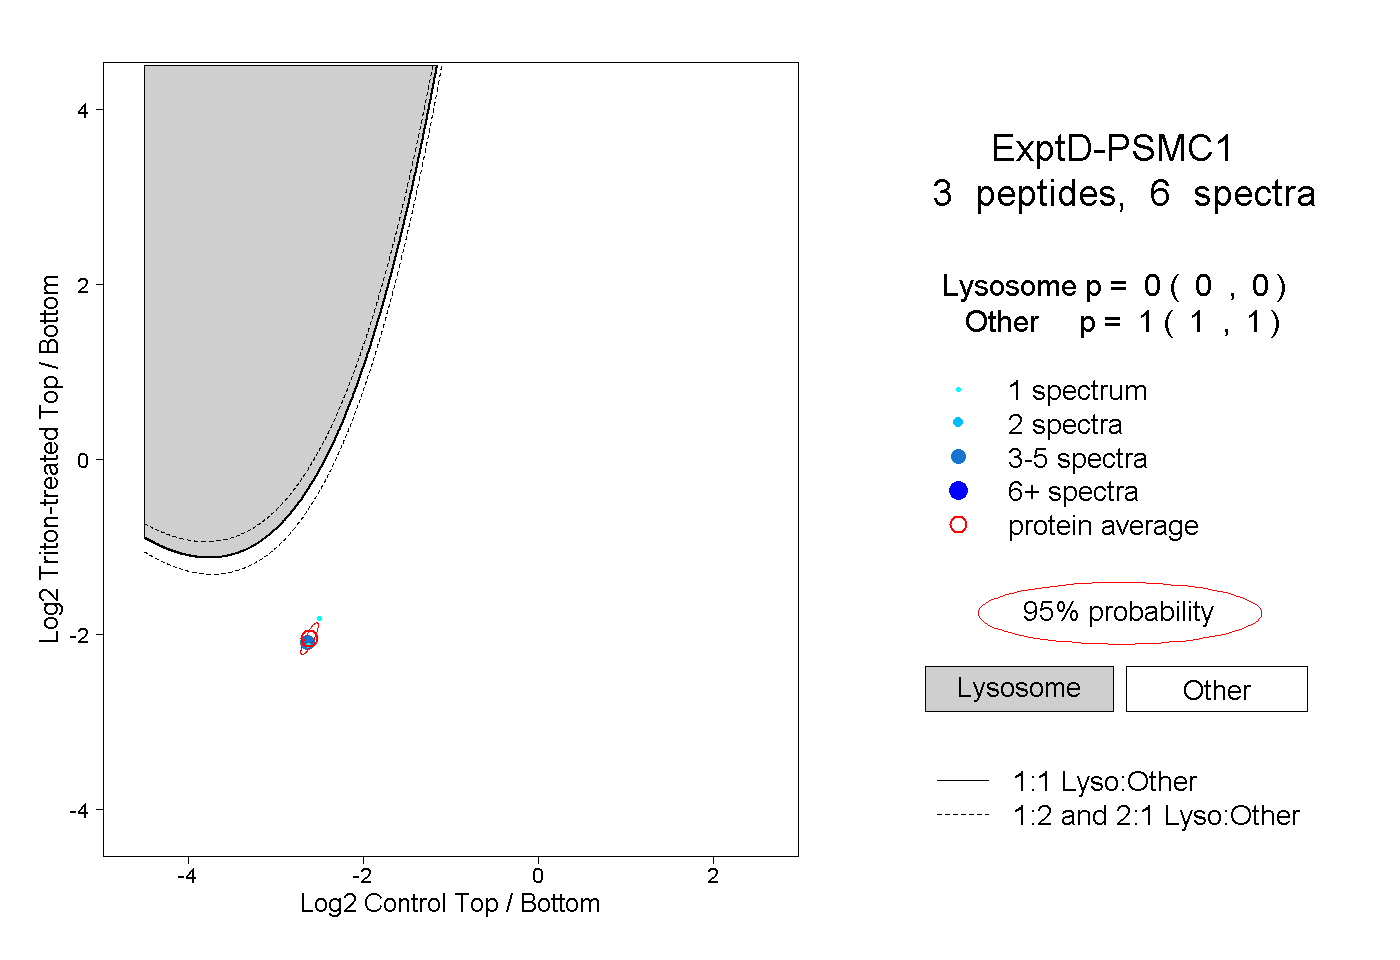
0.000 | 0.000
1.000 | 1.000