 21
21peptides
spectra
0.000 | 0.000
0.000 | 0.000
0.000 | 0.000
0.000 | 0.000
0.039 | 0.045
0.000 | 0.000
0.954 | 0.961
0.000 | 0.000
| Plot | Mito | Lyso | Perox | ER | Golgi | PM | Cytosol | Nucleus | |||||
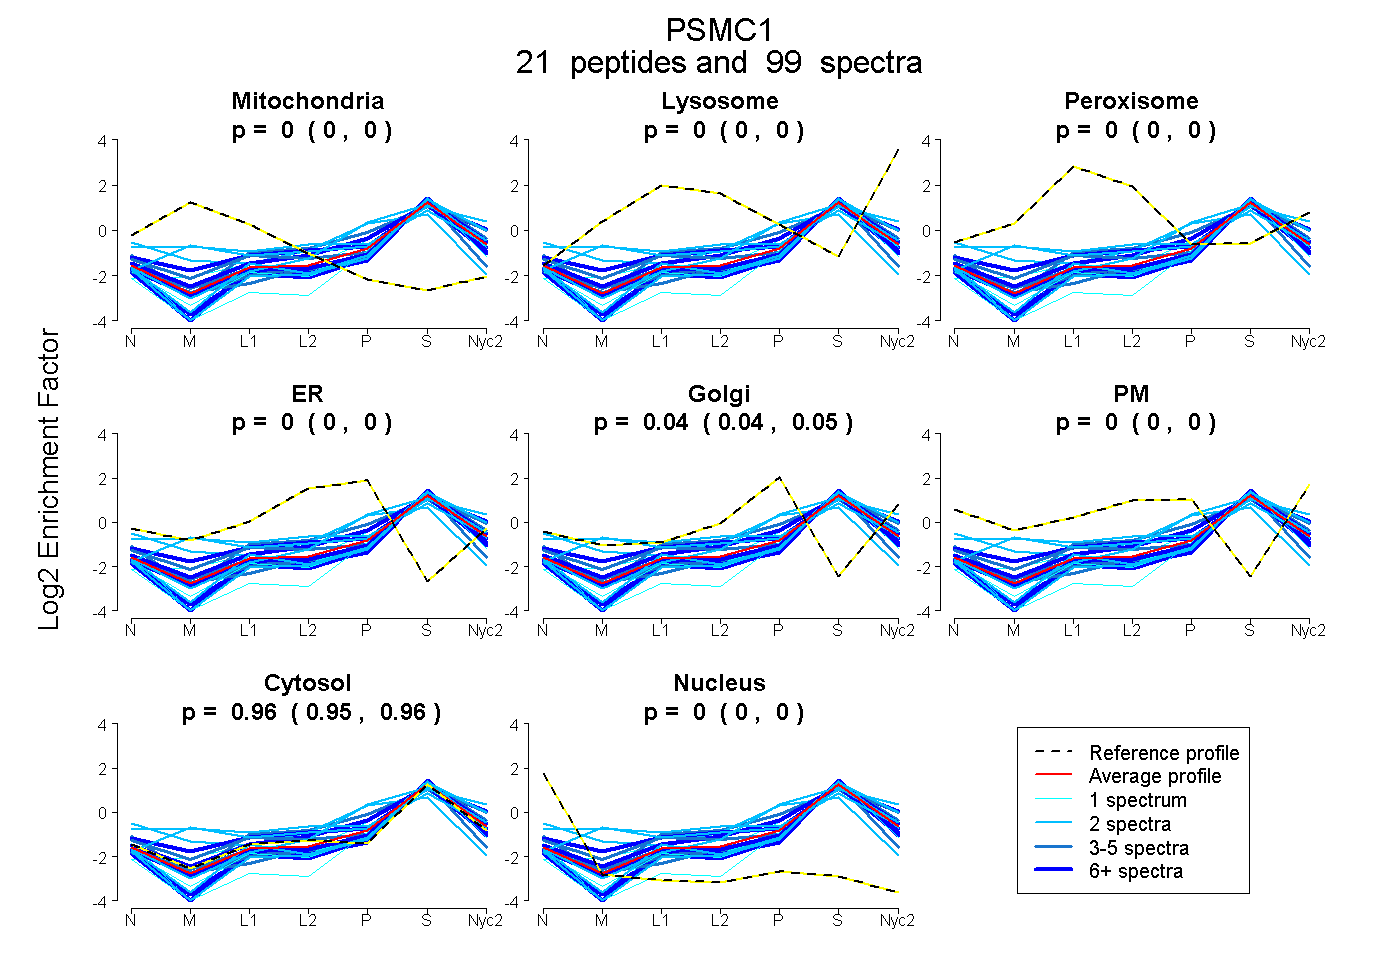
| Expt A |
21 peptides |
99 spectra |
|
0.000 0.000 | 0.000 |
0.000 0.000 | 0.000 |
0.000 0.000 | 0.000 |
0.000 0.000 | 0.000 |
0.042 0.039 | 0.045 |
0.000 0.000 | 0.000 |
0.958 0.954 | 0.961 |
0.000 0.000 | 0.000 |
| 8 spectra, IFQIHTSR | 0.000 | 0.141 | 0.000 | 0.000 | 0.052 | 0.000 | 0.807 | 0.000 | ||
| 1 spectrum, ESVELPLTHPEYYEEMGIKPPK | 0.000 | 0.000 | 0.000 | 0.000 | 0.020 | 0.000 | 0.980 | 0.000 | ||
| 22 spectra, VIMATNR | 0.000 | 0.000 | 0.000 | 0.000 | 0.000 | 0.000 | 1.000 | 0.000 | ||
| 9 spectra, LPLVTPHTQCR | 0.000 | 0.000 | 0.000 | 0.019 | 0.101 | 0.000 | 0.880 | 0.000 | ||
| 5 spectra, GPDAASK | 0.000 | 0.000 | 0.000 | 0.088 | 0.096 | 0.000 | 0.816 | 0.000 | ||
| 2 spectra, VTNEDFK | 0.034 | 0.245 | 0.000 | 0.000 | 0.000 | 0.000 | 0.721 | 0.000 | ||
| 3 spectra, MTLADDVTLDDLIMAK | 0.000 | 0.115 | 0.000 | 0.000 | 0.007 | 0.000 | 0.878 | 0.000 | ||
| 2 spectra, YDSNSGGER | 0.000 | 0.000 | 0.000 | 0.000 | 0.183 | 0.000 | 0.817 | 0.000 | ||
| 2 spectra, YEPPVPTR | 0.000 | 0.000 | 0.000 | 0.000 | 0.000 | 0.000 | 1.000 | 0.000 | ||
| 1 spectrum, VAEEHAPSIVFIDEIDAIGTK | 0.000 | 0.000 | 0.000 | 0.000 | 0.000 | 0.000 | 0.931 | 0.069 | ||
| 4 spectra, AICTEAGLMALR | 0.000 | 0.000 | 0.000 | 0.000 | 0.000 | 0.000 | 0.946 | 0.054 | ||
| 1 spectrum, TMLELLNQLDGFDSR | 0.000 | 0.000 | 0.000 | 0.000 | 0.000 | 0.000 | 0.999 | 0.001 | ||
| 1 spectrum, APQETYADIGGLDNQIQEIK | 0.000 | 0.031 | 0.000 | 0.000 | 0.000 | 0.000 | 0.969 | 0.000 | ||
| 9 spectra, AVANQTSATFLR | 0.000 | 0.000 | 0.000 | 0.000 | 0.000 | 0.000 | 1.000 | 0.000 | ||
| 2 spectra, IEFPLPDEK | 0.004 | 0.000 | 0.000 | 0.265 | 0.000 | 0.000 | 0.647 | 0.084 | ||
| 6 spectra, GVLLYGPPGTGK | 0.000 | 0.000 | 0.000 | 0.000 | 0.000 | 0.000 | 0.990 | 0.010 | ||
| 3 spectra, NQEQMKPLEEK | 0.000 | 0.000 | 0.000 | 0.000 | 0.000 | 0.000 | 1.000 | 0.000 | ||
| 10 spectra, DDLSGADIK | 0.000 | 0.000 | 0.000 | 0.000 | 0.000 | 0.000 | 0.979 | 0.021 | ||
| 2 spectra, QEGTPEGLYL | 0.106 | 0.000 | 0.153 | 0.000 | 0.100 | 0.002 | 0.638 | 0.000 | ||
| 4 spectra, IETLDPALIRPGR | 0.000 | 0.000 | 0.000 | 0.000 | 0.000 | 0.000 | 1.000 | 0.000 | ||
| 2 spectra, VVGSELIQK | 0.000 | 0.000 | 0.000 | 0.000 | 0.000 | 0.000 | 0.991 | 0.009 |
| Plot | Mito | Lyso or Perox | ER | Golgi | PM | Cytosol | Nucleus | ||||||
| Expt B |
11 peptides |
27 spectra |
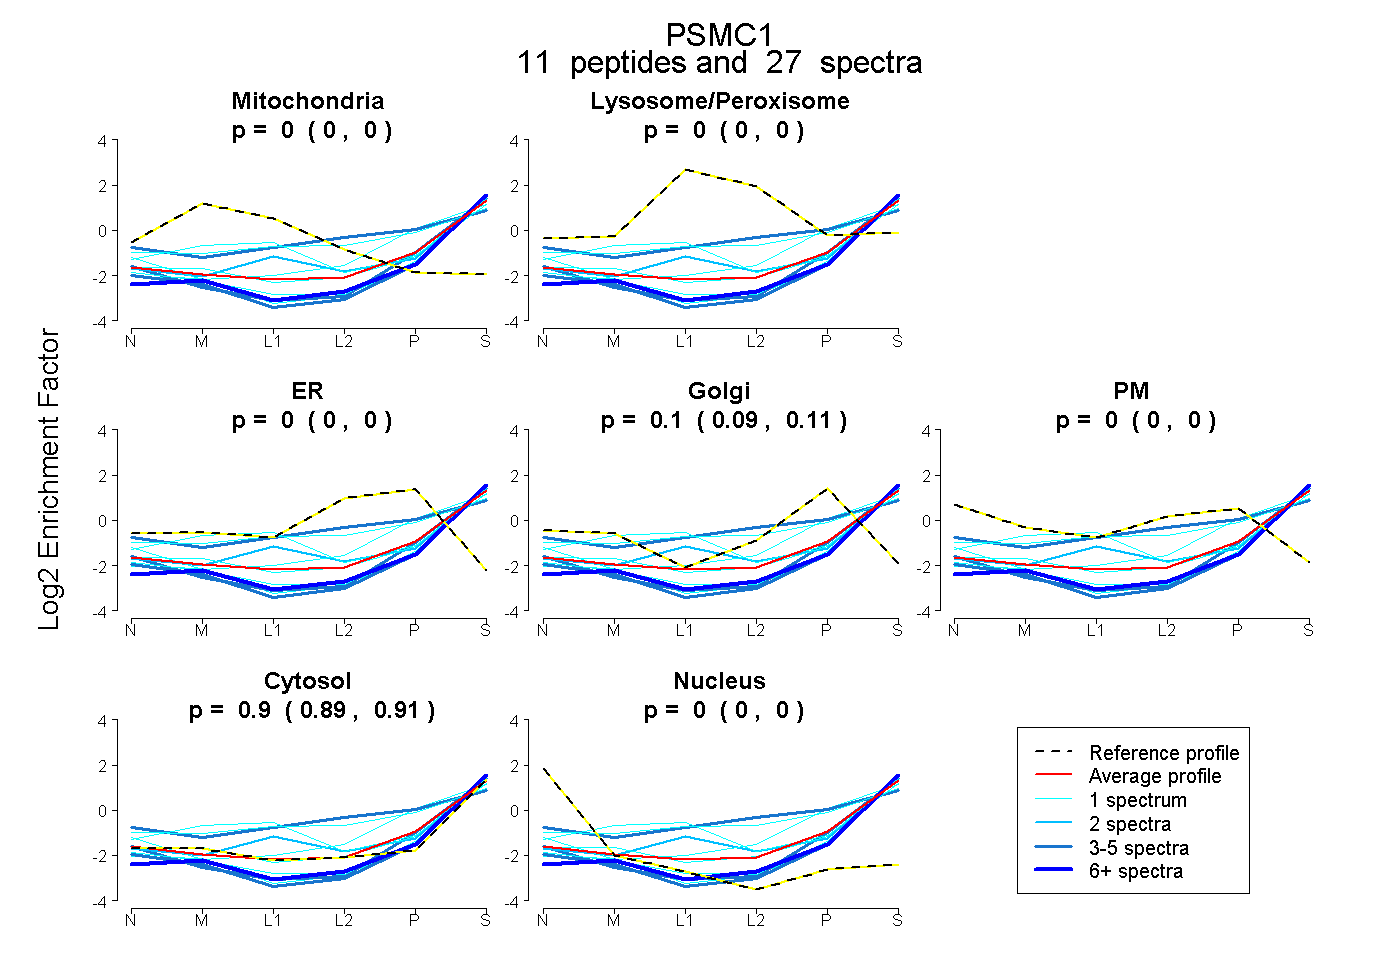 |
0.000 0.000 | 0.000 |
0.000 0.000 | 0.002 |
0.000 0.000 | 0.000 |
0.100 0.088 | 0.109 |
0.000 0.000 | 0.000 |
0.900 0.888 | 0.910 |
0.000 0.000 | 0.000 |
|||
| Plot | Lyso | Other | |||||||||||
| Expt C |
11 peptides |
51 spectra |
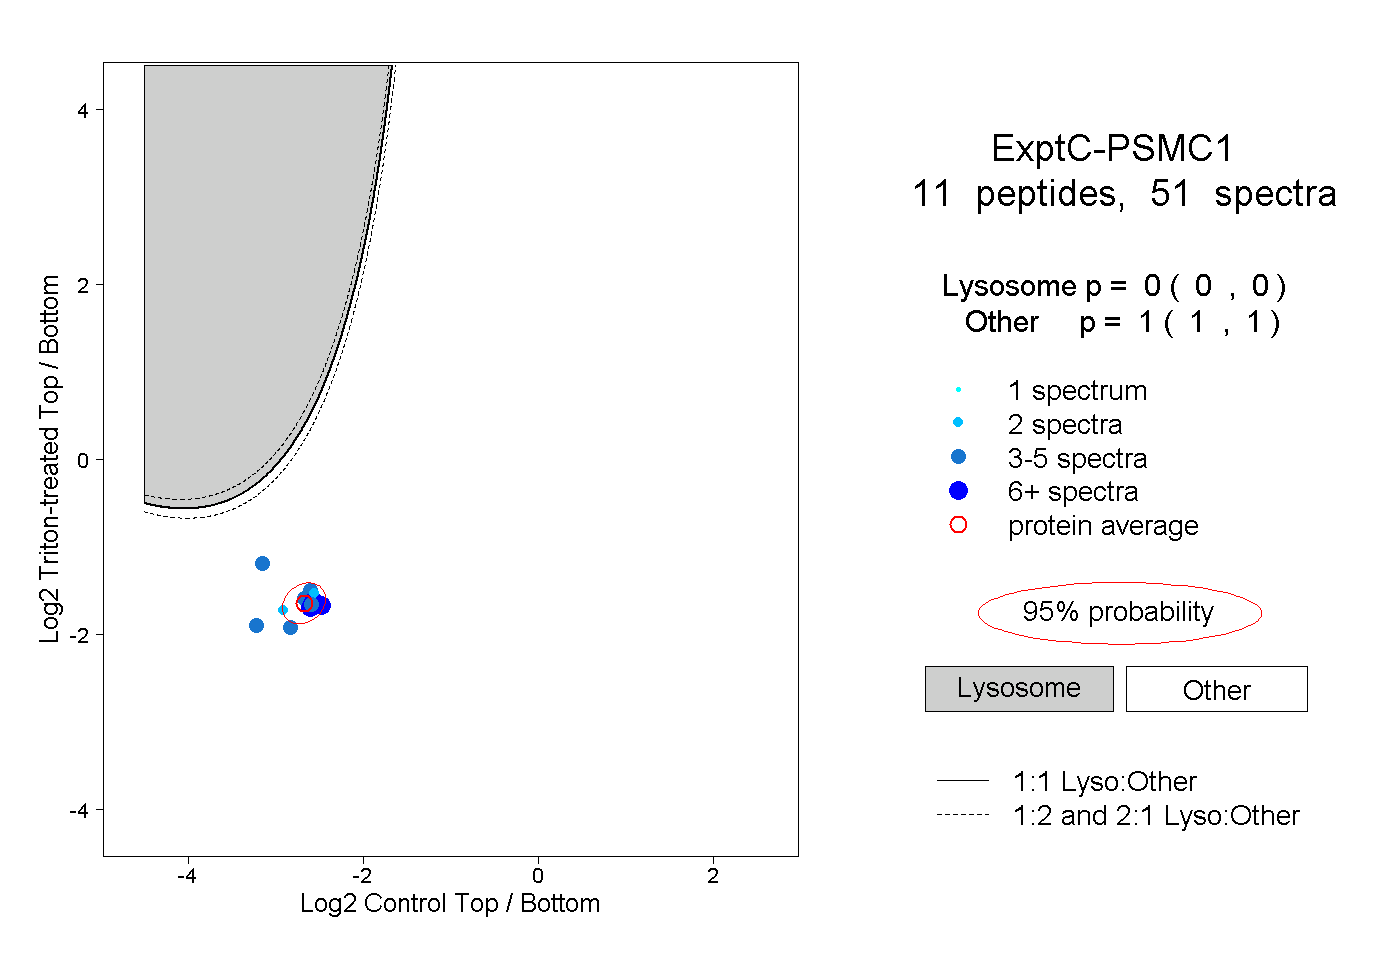 |
0.000 0.000 | 0.000 |
1.000 1.000 | 1.000 |
||||||||
| Plot | Lyso | Other | |||||||||||
| Expt D |
3 peptides |
6 spectra |
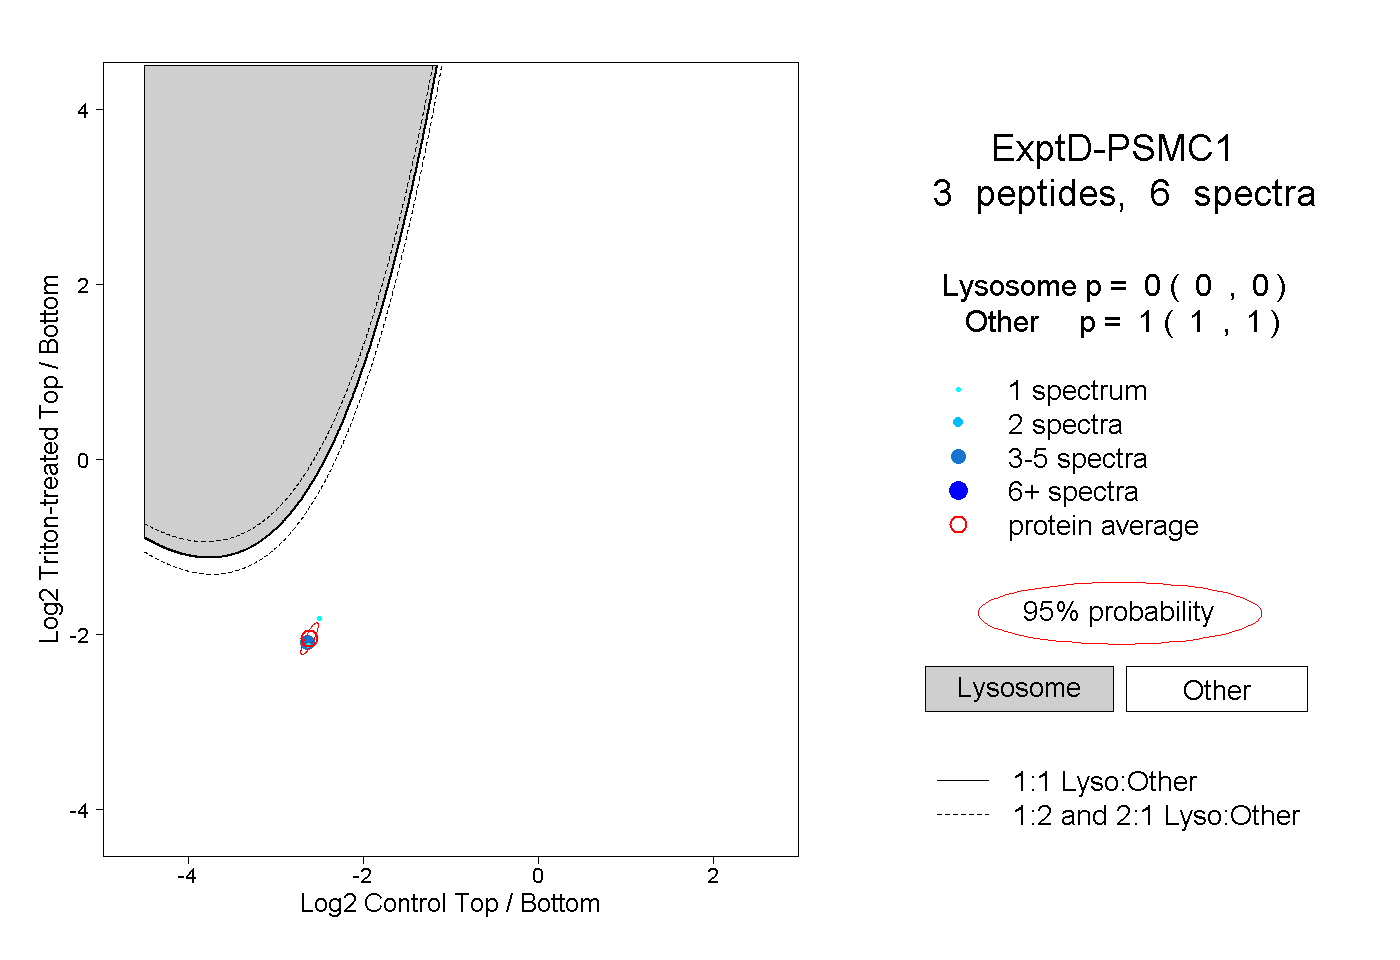 |
0.000 0.000 | 0.000 |
1.000 1.000 | 1.000 |