 35
35peptides
spectra
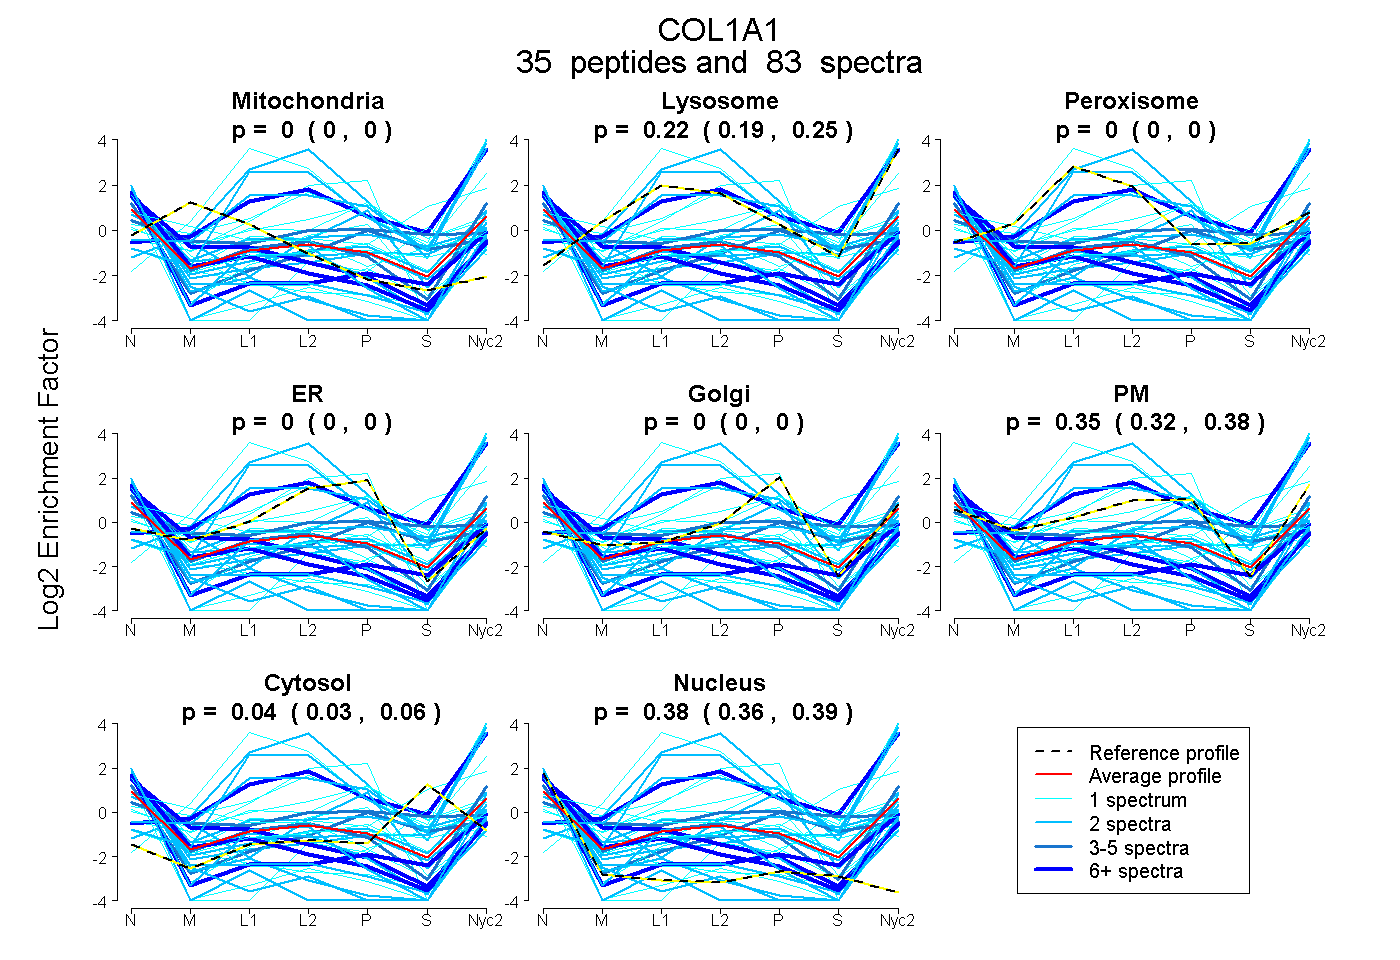
0.000 | 0.000
0.193 | 0.245
0.000 | 0.000
0.000 | 0.000
0.000 | 0.000
0.322 | 0.377
0.030 | 0.059
0.364 | 0.394
4peptides
spectra
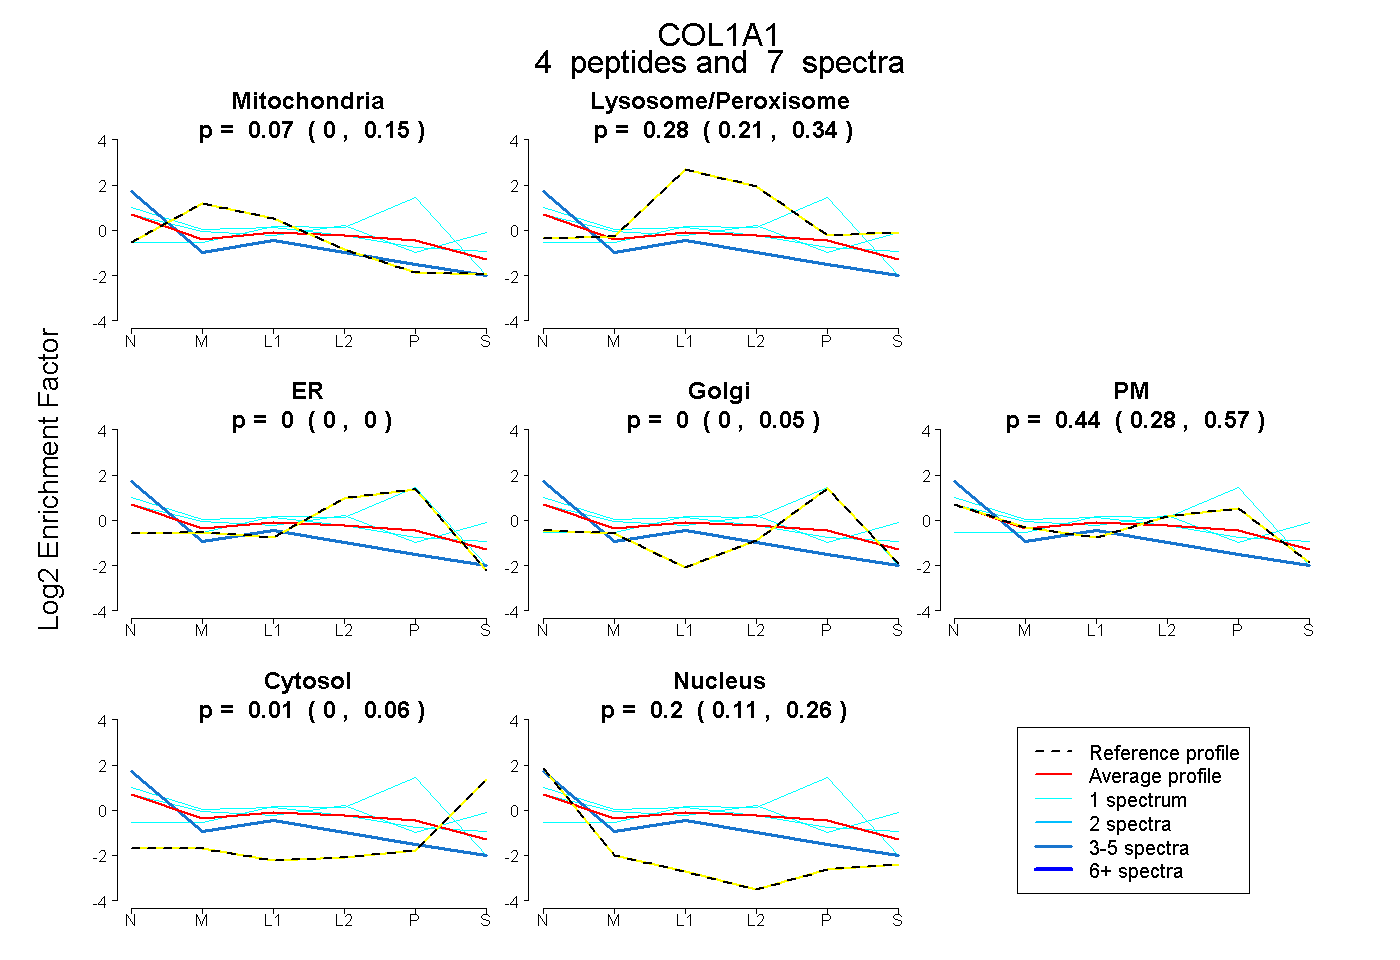
0.000 | 0.150
0.209 | 0.337
0.000 | 0.000
0.000 | 0.052
0.280 | 0.568
0.000 | 0.062
0.110 | 0.258
33peptides
spectra
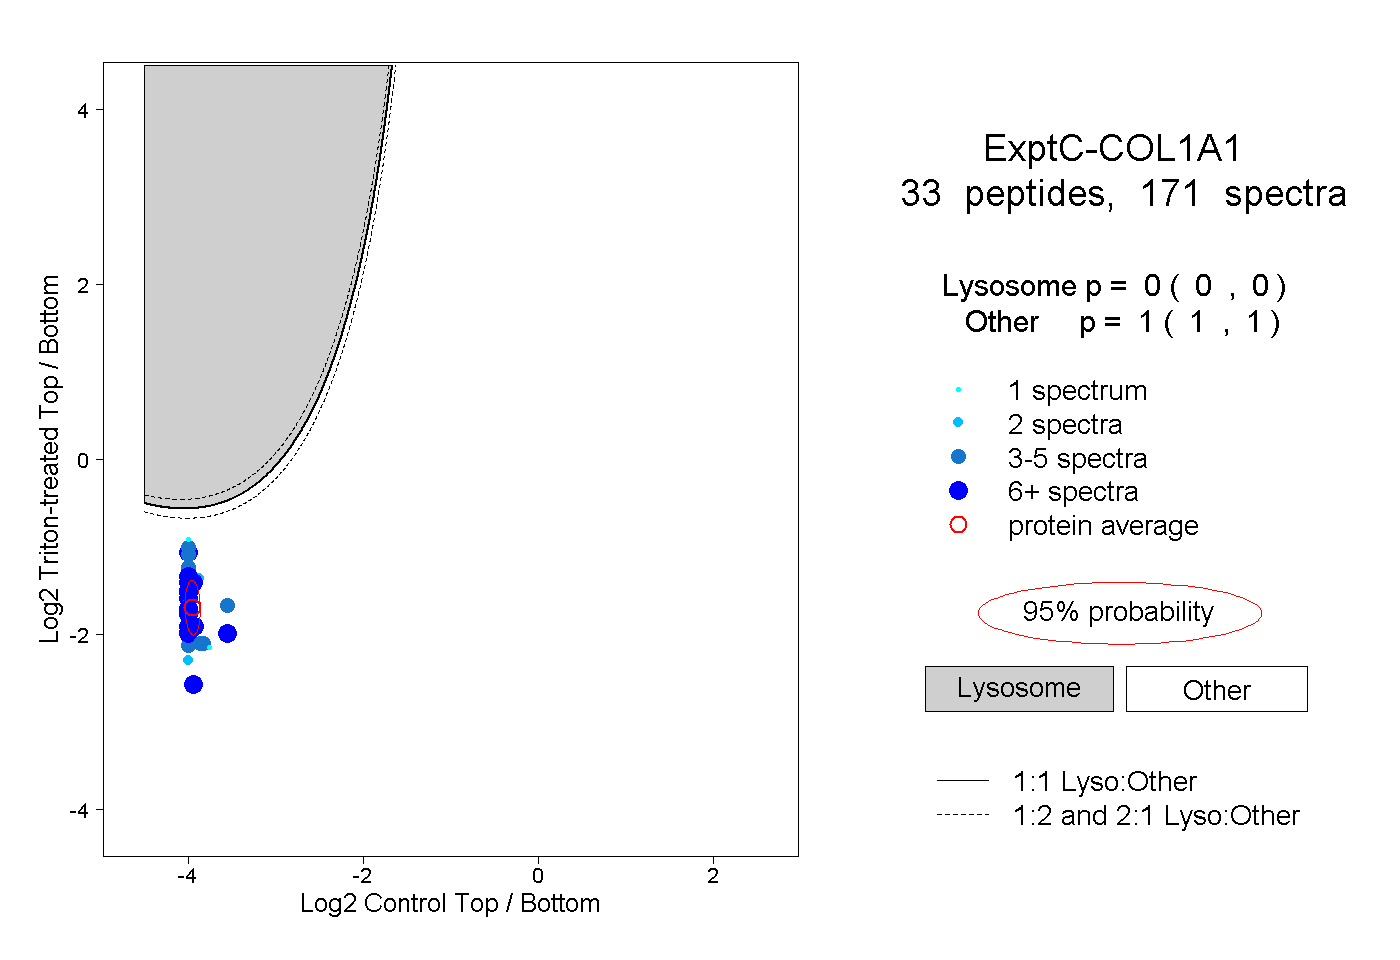
0.000 | 0.000
1.000 | 1.000
9peptides
spectra
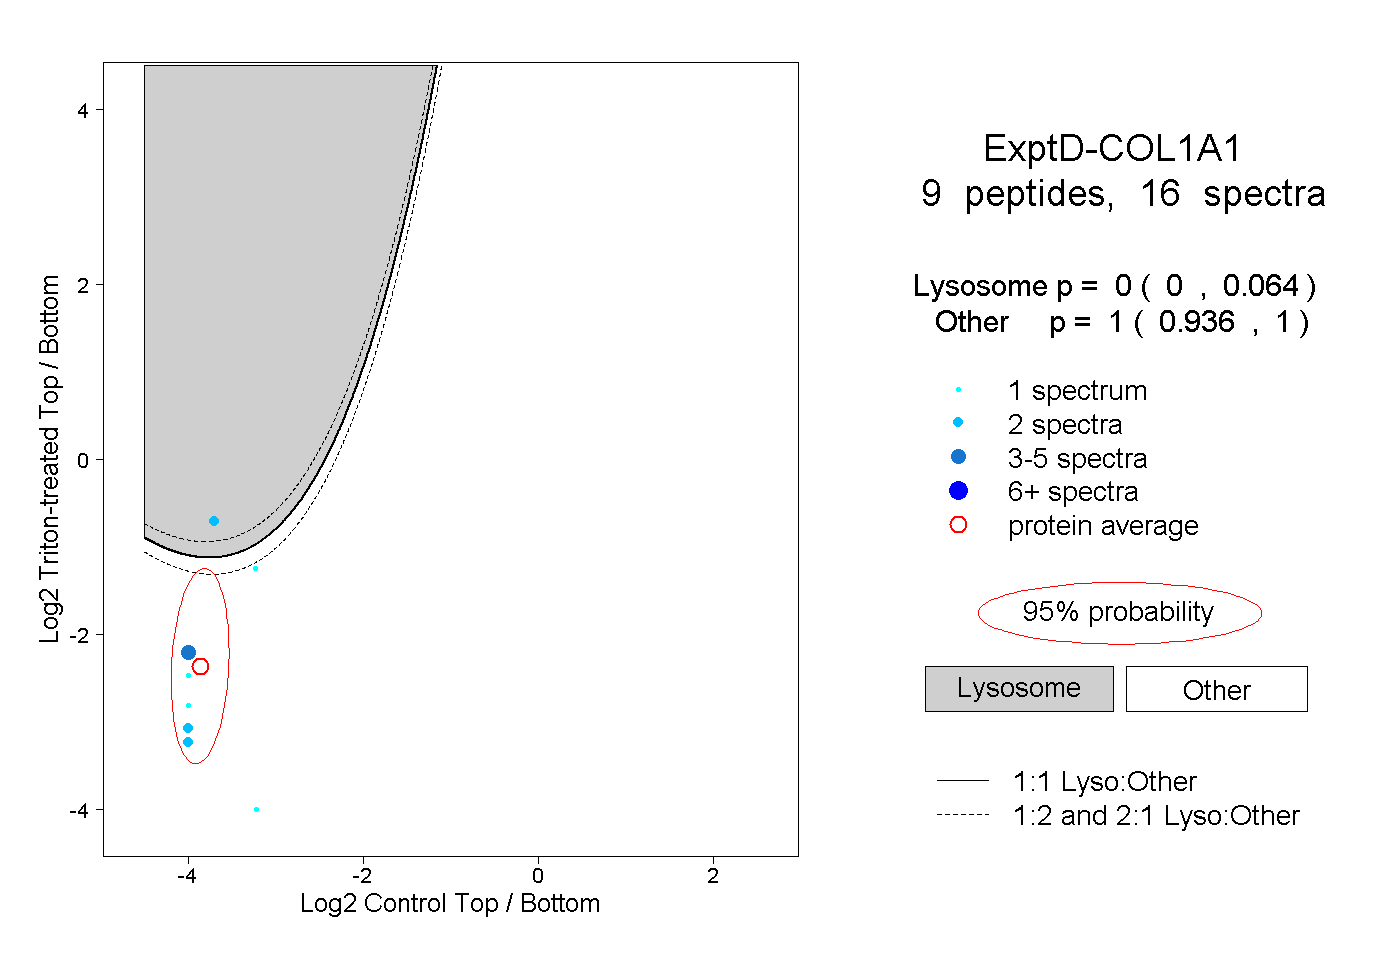
0.000 | 0.064
0.936 | 1.000