 35
35peptides
spectra
0.000 | 0.000
0.193 | 0.245
0.000 | 0.000
0.000 | 0.000
0.000 | 0.000
0.322 | 0.377
0.030 | 0.059
0.364 | 0.394
| Plot | Mito | Lyso | Perox | ER | Golgi | PM | Cytosol | Nucleus | |||||
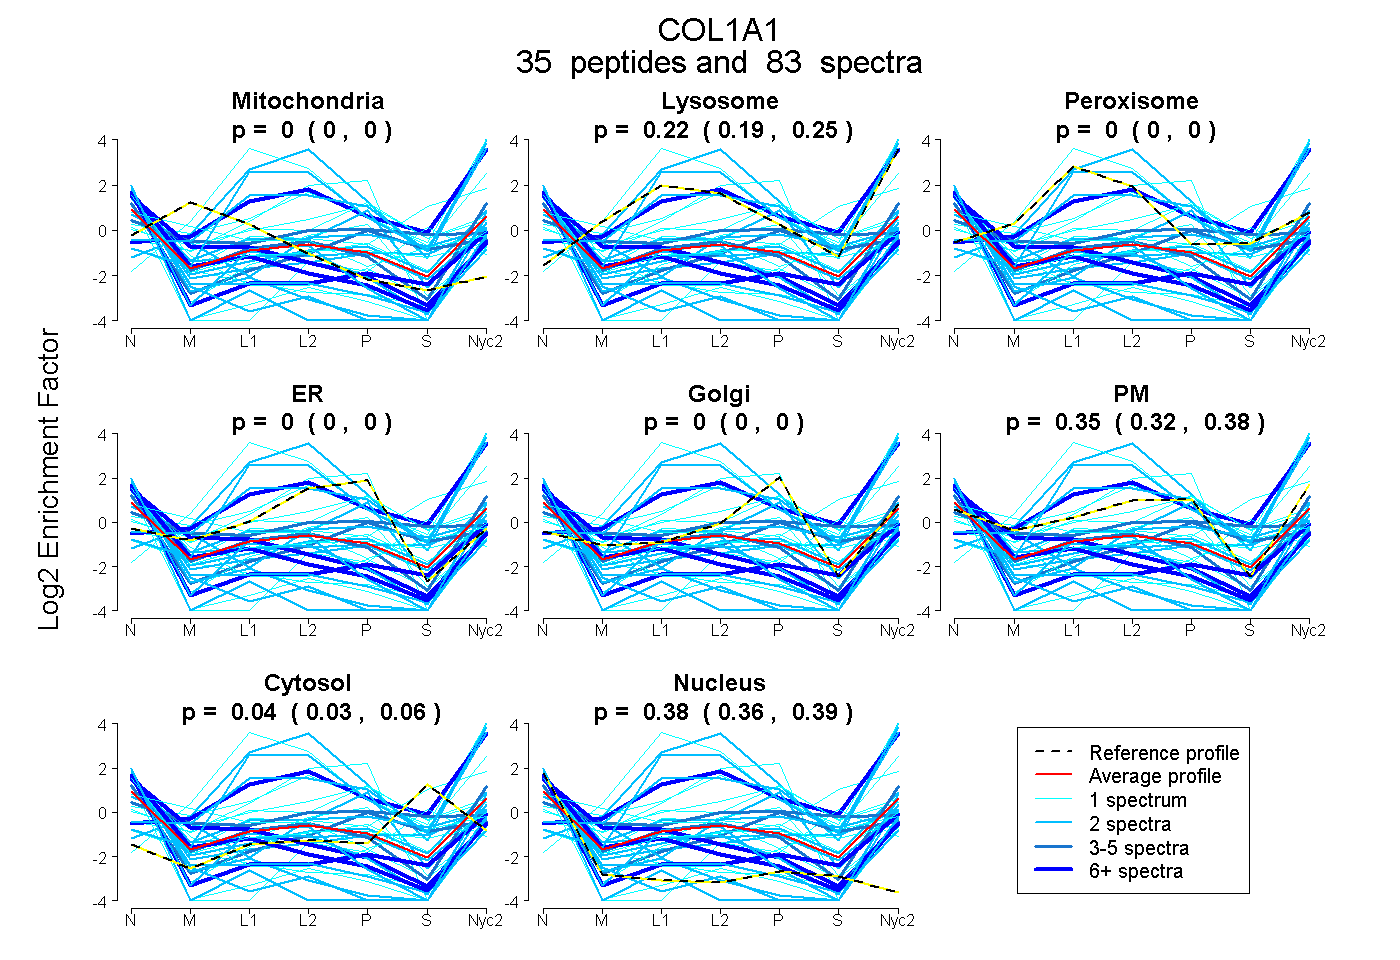
| Expt A |
35 peptides |
83 spectra |
|
0.000 0.000 | 0.000 |
0.223 0.193 | 0.245 |
0.000 0.000 | 0.000 |
0.000 0.000 | 0.000 |
0.000 0.000 | 0.000 |
0.351 0.322 | 0.377 |
0.045 0.030 | 0.059 |
0.381 0.364 | 0.394 |
| 6 spectra, GSPGPAGPK | 0.047 | 0.165 | 0.000 | 0.000 | 0.000 | 0.177 | 0.000 | 0.612 | ||
| 1 spectrum, GVVGLPGQR | 0.000 | 0.000 | 0.000 | 0.000 | 0.000 | 0.526 | 0.120 | 0.355 | ||
| 2 spectra, GFPGLPGPSGEPGK | 0.000 | 0.218 | 0.000 | 0.000 | 0.000 | 0.000 | 0.000 | 0.782 | ||
| 2 spectra, MCHSDWK | 0.000 | 0.899 | 0.071 | 0.000 | 0.000 | 0.030 | 0.000 | 0.000 | ||
| 1 spectrum, FTYSTLVDGCTSHTGTWGK | 0.000 | 0.969 | 0.031 | 0.000 | 0.000 | 0.000 | 0.000 | 0.000 | ||
| 2 spectra, GPSGPQGPSGAPGPK | 0.000 | 0.133 | 0.000 | 0.000 | 0.000 | 0.000 | 0.000 | 0.867 | ||
| 1 spectrum, GEPGPPGPAGFAGPPGADGQPGAK | 0.000 | 0.000 | 0.240 | 0.000 | 0.361 | 0.188 | 0.211 | 0.000 | ||
| 2 spectra, GDTGPAGPK | 0.000 | 0.000 | 0.000 | 0.000 | 0.221 | 0.567 | 0.000 | 0.212 | ||
| 2 spectra, EDLDCPNPQK | 0.000 | 1.000 | 0.000 | 0.000 | 0.000 | 0.000 | 0.000 | 0.000 | ||
| 10 spectra, GPPGSAGSPGK | 0.000 | 0.029 | 0.000 | 0.000 | 0.000 | 0.257 | 0.093 | 0.621 | ||
| 3 spectra, GFPGADGVAGPK | 0.000 | 0.000 | 0.000 | 0.000 | 0.207 | 0.201 | 0.303 | 0.288 | ||
| 2 spectra, SLSQQIENIR | 0.000 | 0.712 | 0.000 | 0.000 | 0.000 | 0.288 | 0.000 | 0.000 | ||
| 2 spectra, GPPGPQGAR | 0.000 | 0.116 | 0.000 | 0.000 | 0.000 | 0.408 | 0.000 | 0.476 | ||
| 1 spectrum, GEPGPSGLPGPPGER | 0.000 | 0.022 | 0.000 | 0.000 | 0.000 | 0.165 | 0.000 | 0.812 | ||
| 2 spectra, GLTGSPGSPGPDGK | 0.000 | 0.000 | 0.000 | 0.000 | 0.006 | 0.499 | 0.321 | 0.175 | ||
| 3 spectra, GPPGPMGPPGLAGPPGESGR | 0.088 | 0.000 | 0.060 | 0.018 | 0.000 | 0.427 | 0.393 | 0.015 | ||
| 2 spectra, GEPGDTGVK | 0.000 | 0.000 | 0.018 | 0.000 | 0.000 | 0.441 | 0.249 | 0.292 | ||
| 2 spectra, GRPGPPGSAGAR | 0.000 | 0.124 | 0.000 | 0.000 | 0.000 | 0.108 | 0.000 | 0.768 | ||
| 1 spectrum, GEAGPQGAR | 0.000 | 0.000 | 0.000 | 0.235 | 0.000 | 0.398 | 0.000 | 0.367 | ||
| 2 spectra, GADGSPGK | 0.000 | 0.000 | 0.000 | 0.000 | 0.000 | 0.474 | 0.066 | 0.459 | ||
| 1 spectrum, ADDANVVR | 0.000 | 0.385 | 0.047 | 0.000 | 0.000 | 0.494 | 0.075 | 0.000 | ||
| 2 spectra, VGPPGPSGNAGPPGPPGPVGK | 0.000 | 0.130 | 0.000 | 0.000 | 0.000 | 0.347 | 0.000 | 0.522 | ||
| 1 spectrum, GFPGER | 0.025 | 0.001 | 0.000 | 0.000 | 0.000 | 0.347 | 0.000 | 0.627 | ||
| 1 spectrum, GANGAPGIAGAPGFPGAR | 0.000 | 0.000 | 0.000 | 1.000 | 0.000 | 0.000 | 0.000 | 0.000 | ||
| 1 spectrum, GFSGLDGAK | 0.000 | 0.000 | 0.000 | 0.000 | 0.000 | 0.347 | 0.274 | 0.378 | ||
| 2 spectra, GDTGAK | 0.000 | 0.000 | 0.000 | 0.000 | 0.000 | 0.577 | 0.110 | 0.314 | ||
| 4 spectra, GPAGPQGPR | 0.000 | 0.062 | 0.000 | 0.000 | 0.000 | 0.596 | 0.000 | 0.342 | ||
| 1 spectrum, GEPGPAGVQGPPGPAGEEGK | 0.000 | 0.000 | 0.000 | 0.000 | 0.000 | 0.000 | 0.555 | 0.445 | ||
| 2 spectra, TGPPGPAGQDGRPGPAGPPGAR | 0.000 | 0.095 | 0.000 | 0.000 | 0.000 | 0.000 | 0.000 | 0.905 | ||
| 1 spectrum, GAAGLPGPK | 0.000 | 0.198 | 0.000 | 0.000 | 0.000 | 0.050 | 0.000 | 0.751 | ||
| 9 spectra, GPPGPPGK | 0.273 | 0.017 | 0.000 | 0.000 | 0.000 | 0.329 | 0.000 | 0.381 | ||
| 6 spectra, GDPGPQGPR | 0.000 | 0.812 | 0.000 | 0.000 | 0.000 | 0.113 | 0.076 | 0.000 | ||
| 1 spectrum, GVPGPPGAVGPAGK | 0.318 | 0.000 | 0.153 | 0.000 | 0.000 | 0.214 | 0.218 | 0.097 | ||
| 1 spectrum, GETGPAGPAGPIGPAGAR | 0.000 | 0.000 | 0.218 | 0.000 | 0.439 | 0.106 | 0.237 | 0.000 | ||
| 1 spectrum, DLEVDTTLK | 0.000 | 0.398 | 0.000 | 0.000 | 0.000 | 0.000 | 0.602 | 0.000 |
| Plot | Mito | Lyso or Perox | ER | Golgi | PM | Cytosol | Nucleus | ||||||
| Expt B |
4 peptides |
7 spectra |
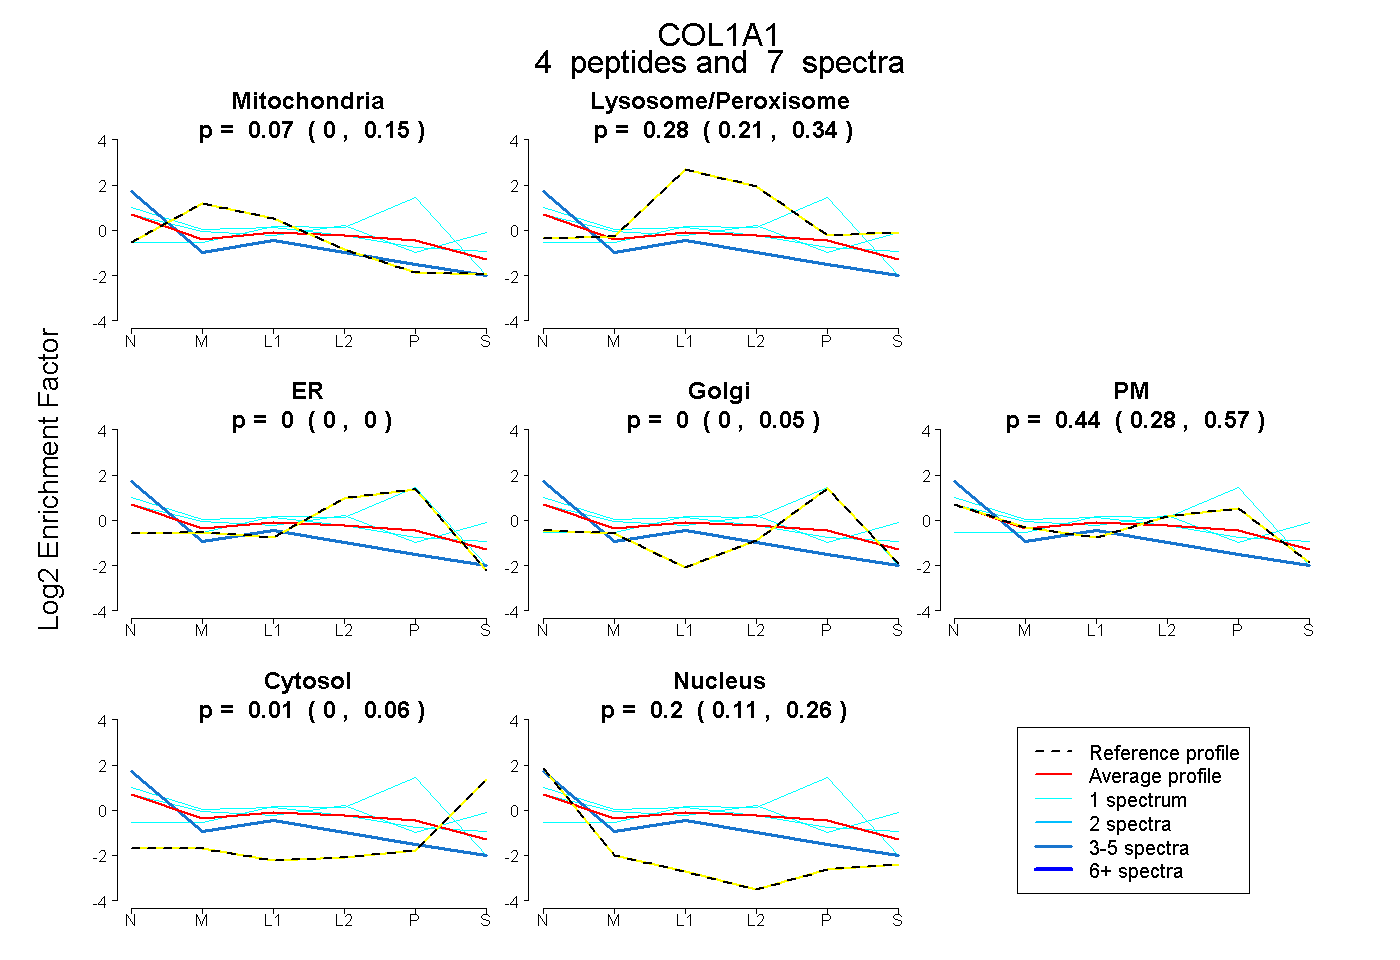 |
0.072 0.000 | 0.150 |
0.279 0.209 | 0.337 |
0.000 0.000 | 0.000 |
0.000 0.000 | 0.052 |
0.444 0.280 | 0.568 |
0.005 0.000 | 0.062 |
0.199 0.110 | 0.258 |
|||
| Plot | Lyso | Other | |||||||||||
| Expt C |
33 peptides |
171 spectra |
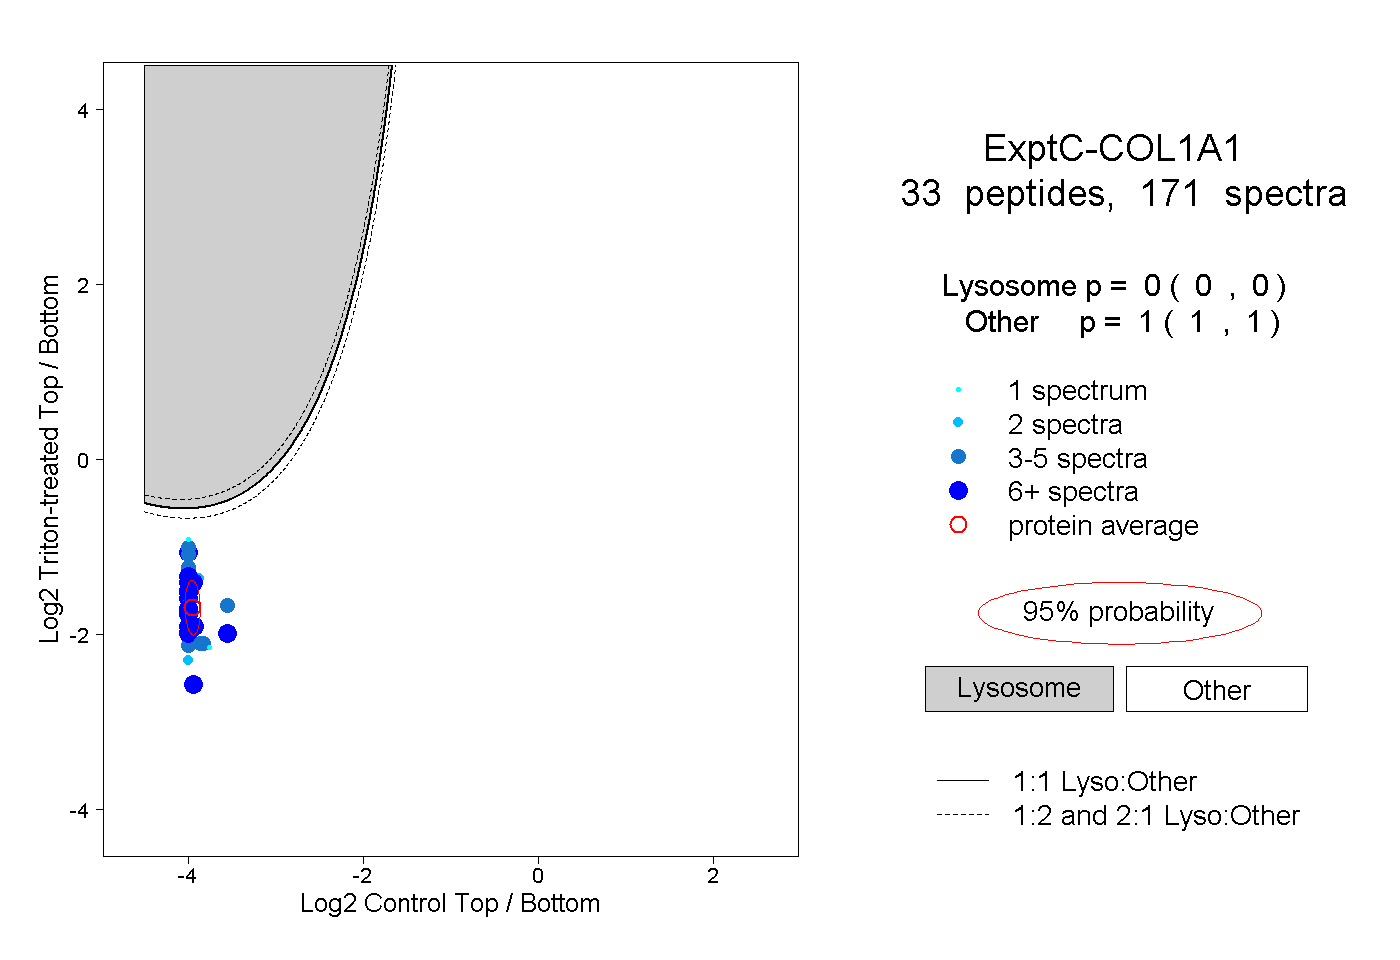 |
0.000 0.000 | 0.000 |
1.000 1.000 | 1.000 |
||||||||
| Plot | Lyso | Other | |||||||||||
| Expt D |
9 peptides |
16 spectra |
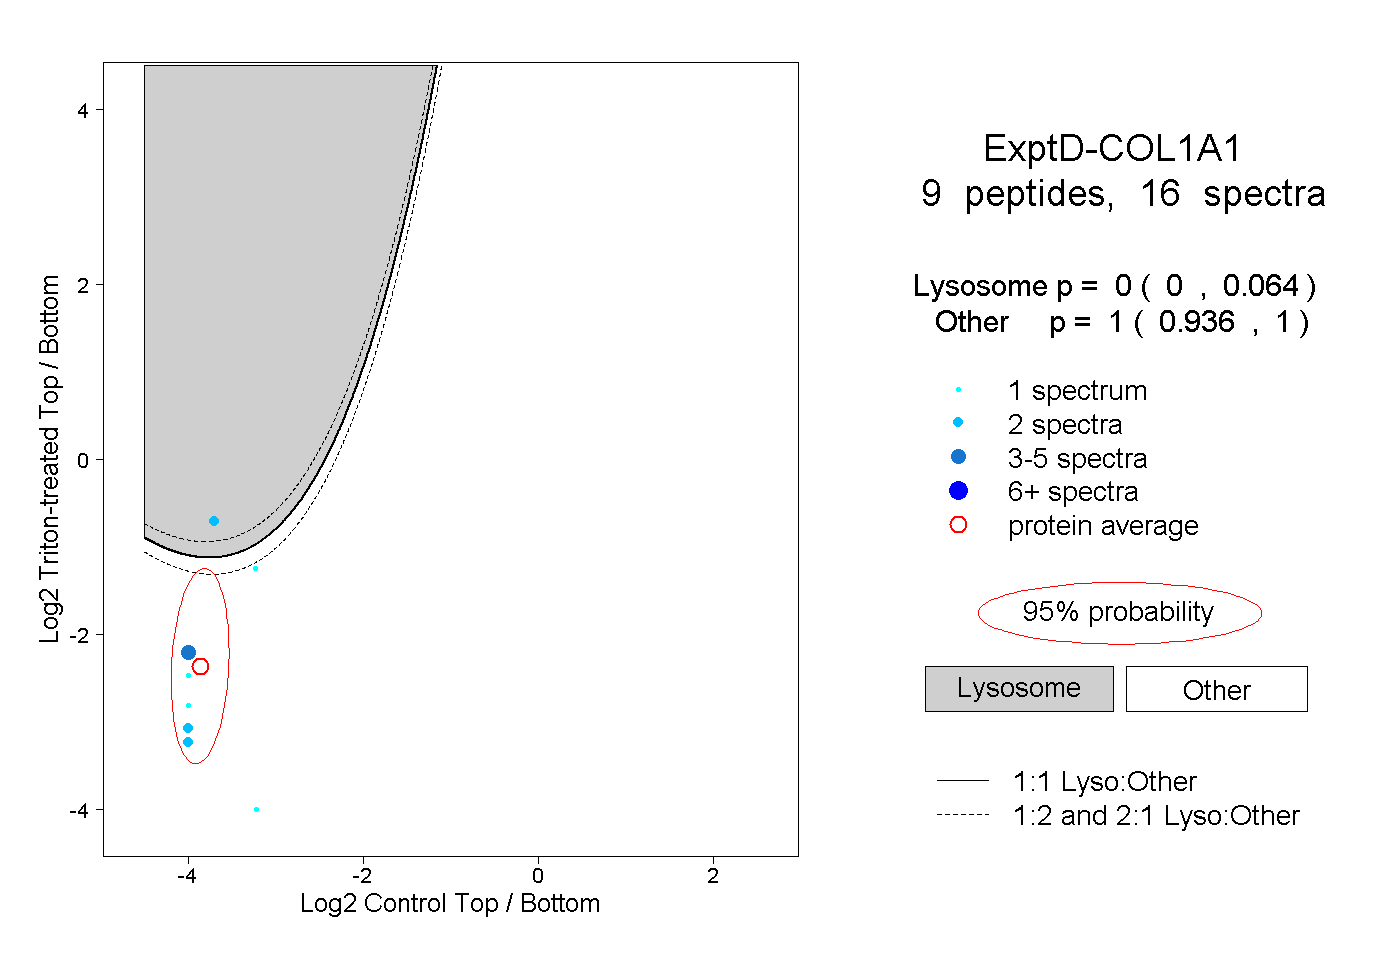 |
0.000 0.000 | 0.064 |
1.000 0.936 | 1.000 |