 8
8peptides
spectra
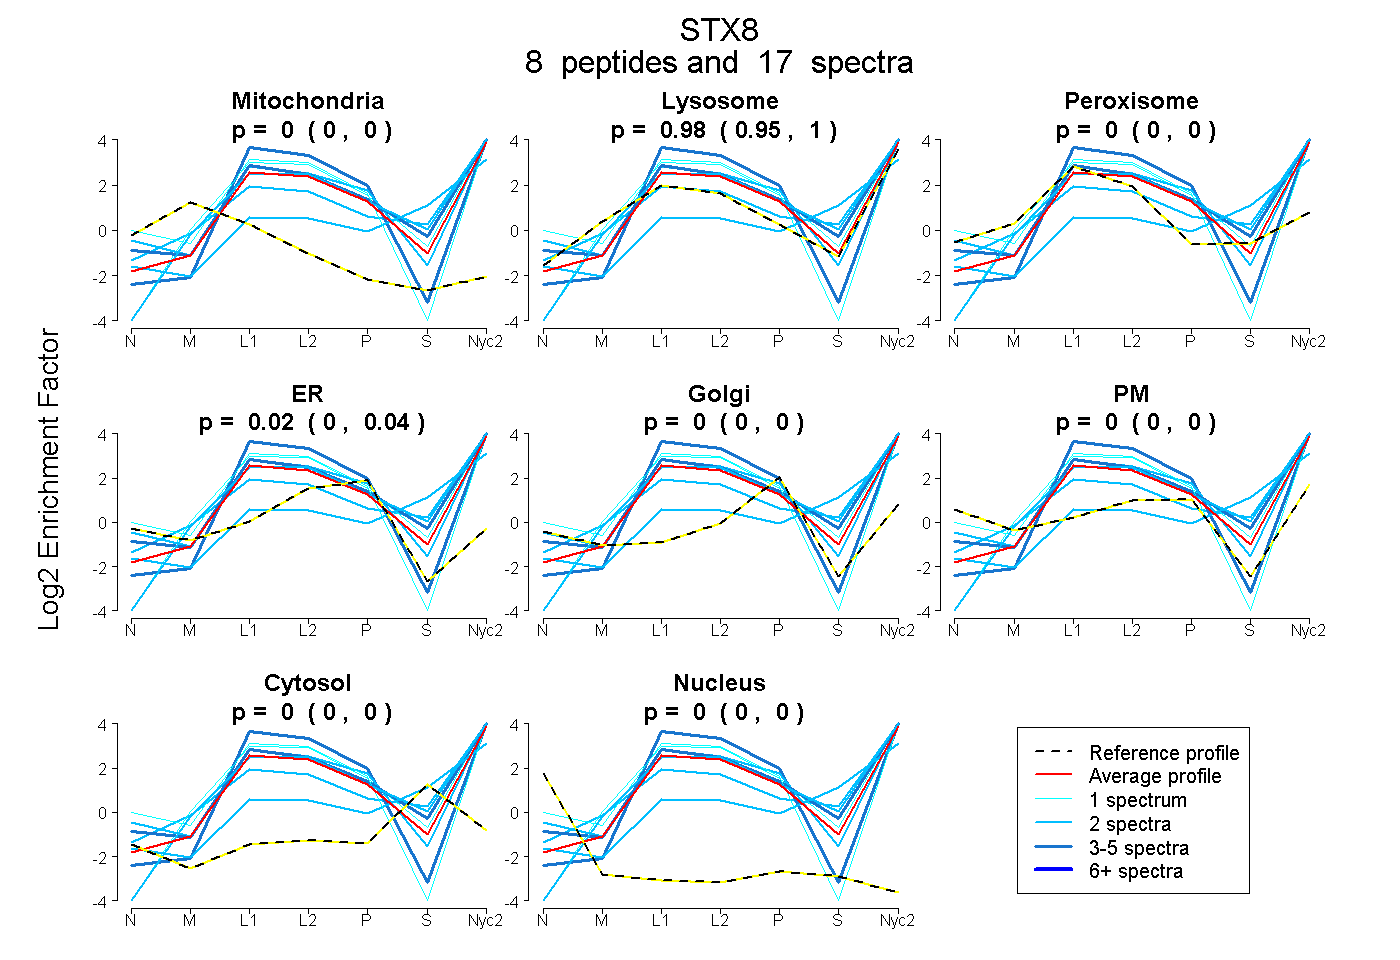
0.000 | 0.000
0.955 | 1.000
0.000 | 0.000
0.000 | 0.039
0.000 | 0.000
0.000 | 0.000
0.000 | 0.000
0.000 | 0.000
4peptides
spectra
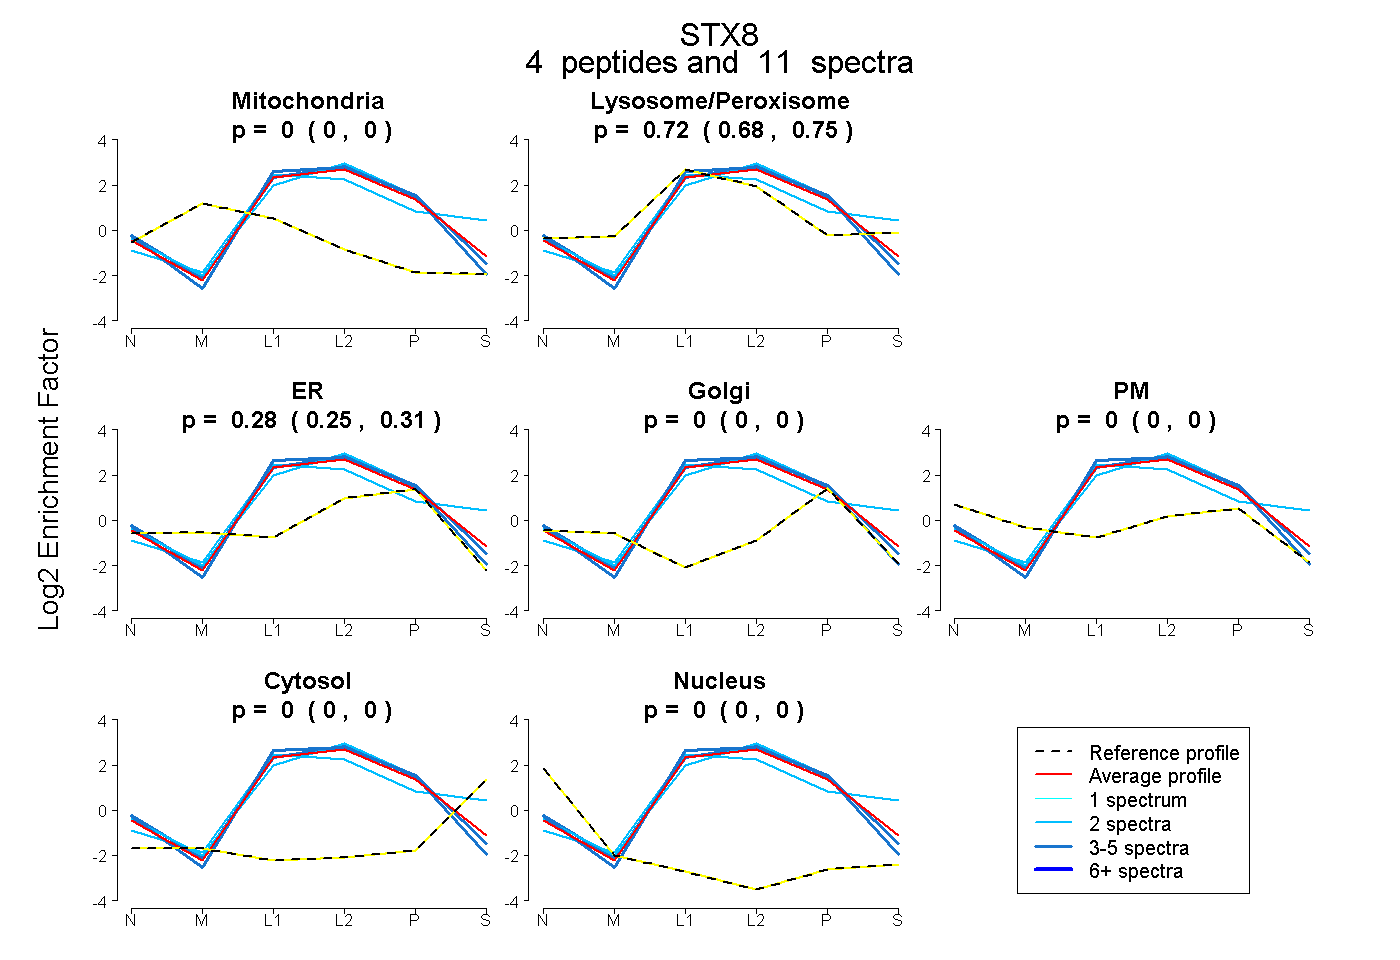
0.000 | 0.000
0.681 | 0.747
0.249 | 0.313
0.000 | 0.000
0.000 | 0.000
0.000 | 0.000
0.000 | 0.000
7peptides
spectra
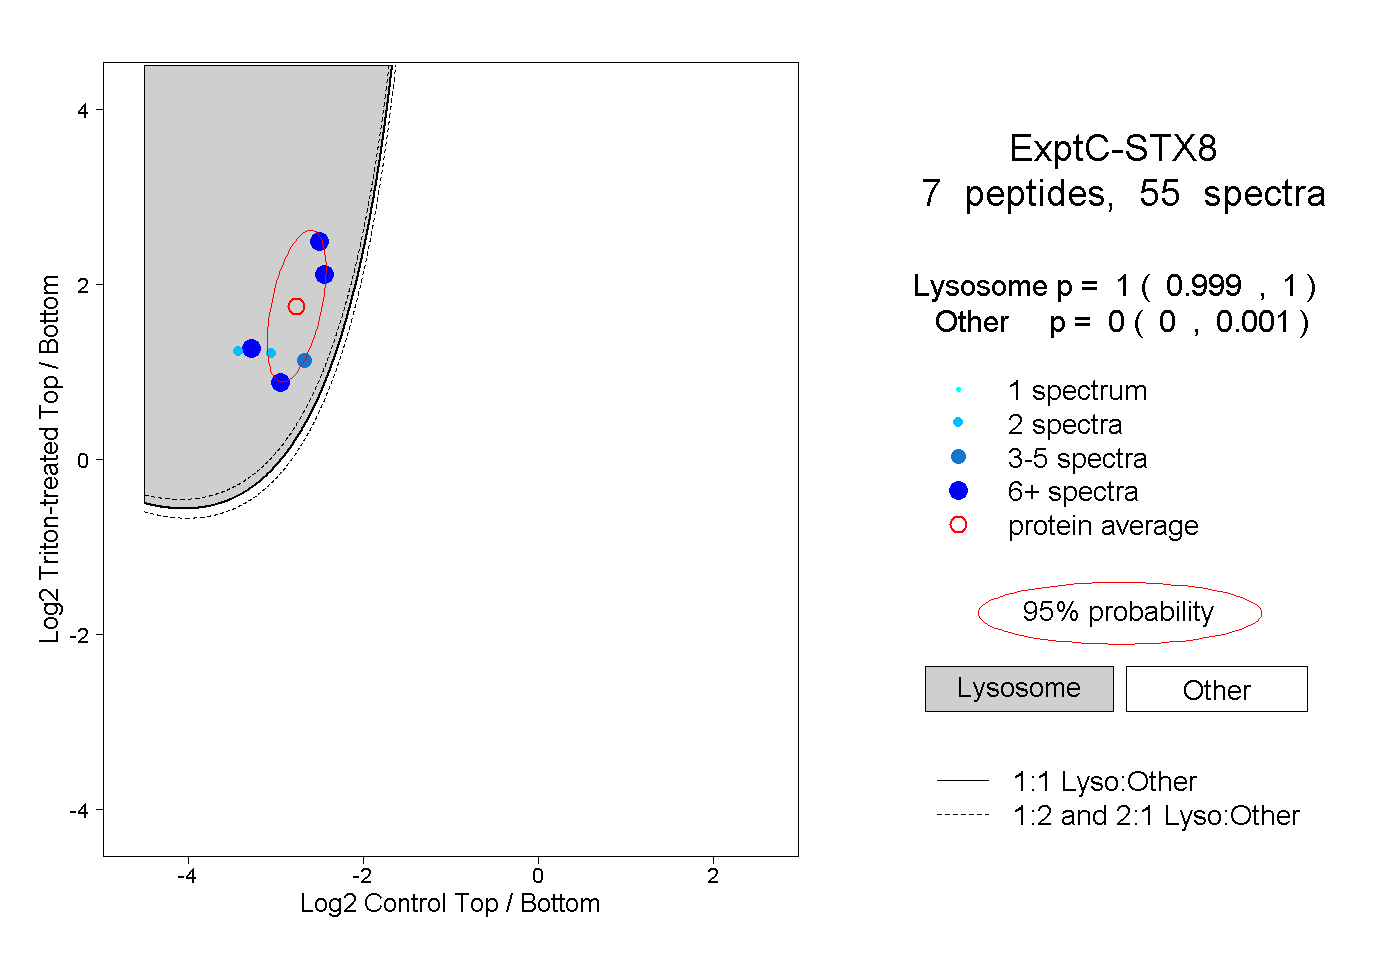
0.999 | 1.000
0.000 | 0.001
2peptides
spectra
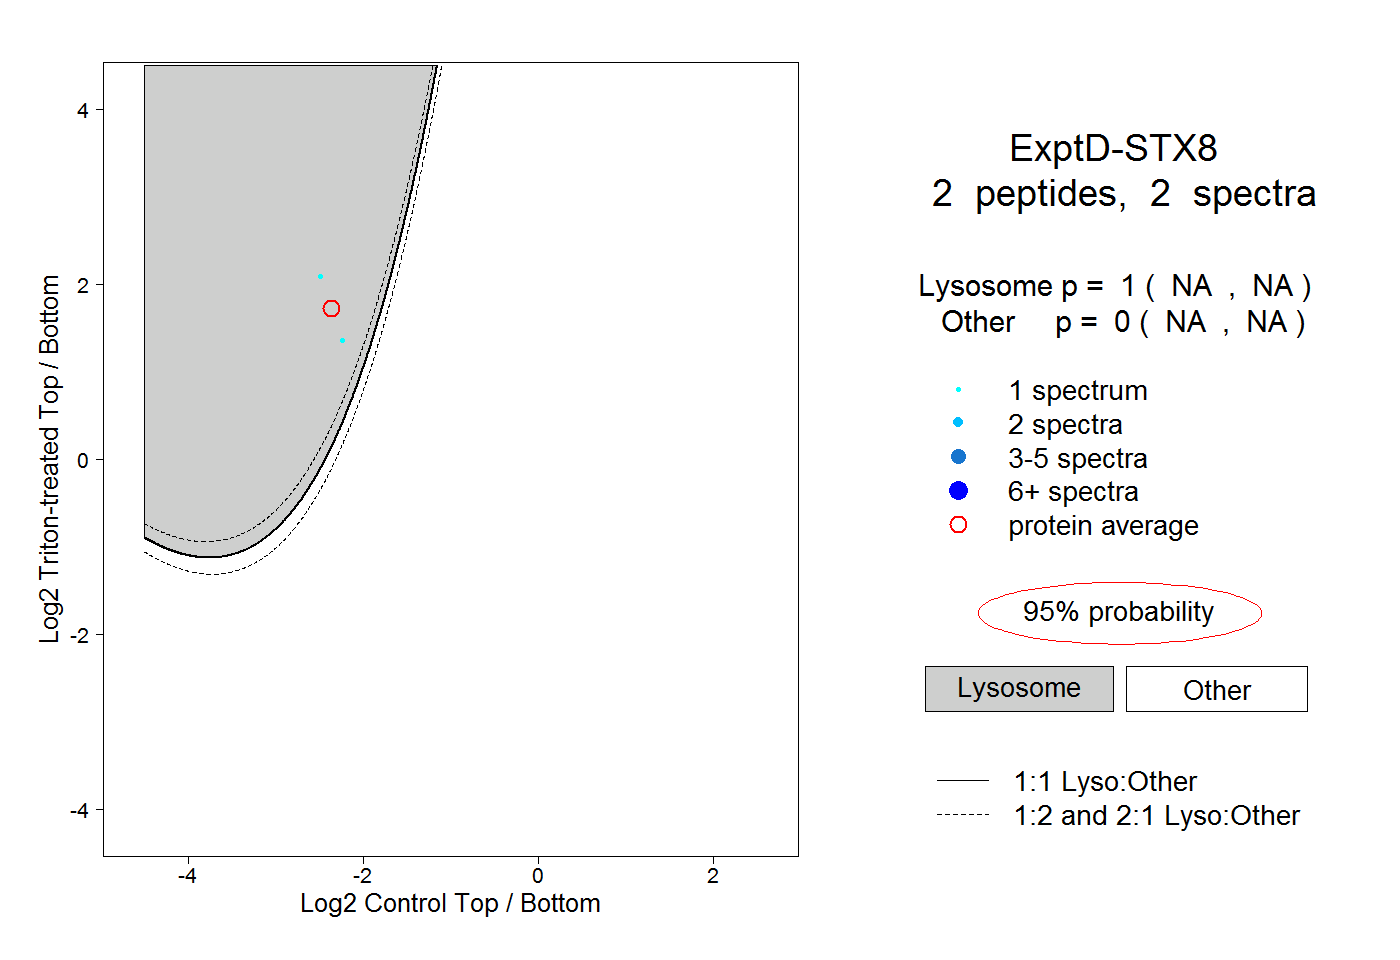
NA | NA
NA | NA