 8
8peptides
spectra
0.000 | 0.000
0.955 | 1.000
0.000 | 0.000
0.000 | 0.039
0.000 | 0.000
0.000 | 0.000
0.000 | 0.000
0.000 | 0.000
| Plot | Mito | Lyso | Perox | ER | Golgi | PM | Cytosol | Nucleus | |||||
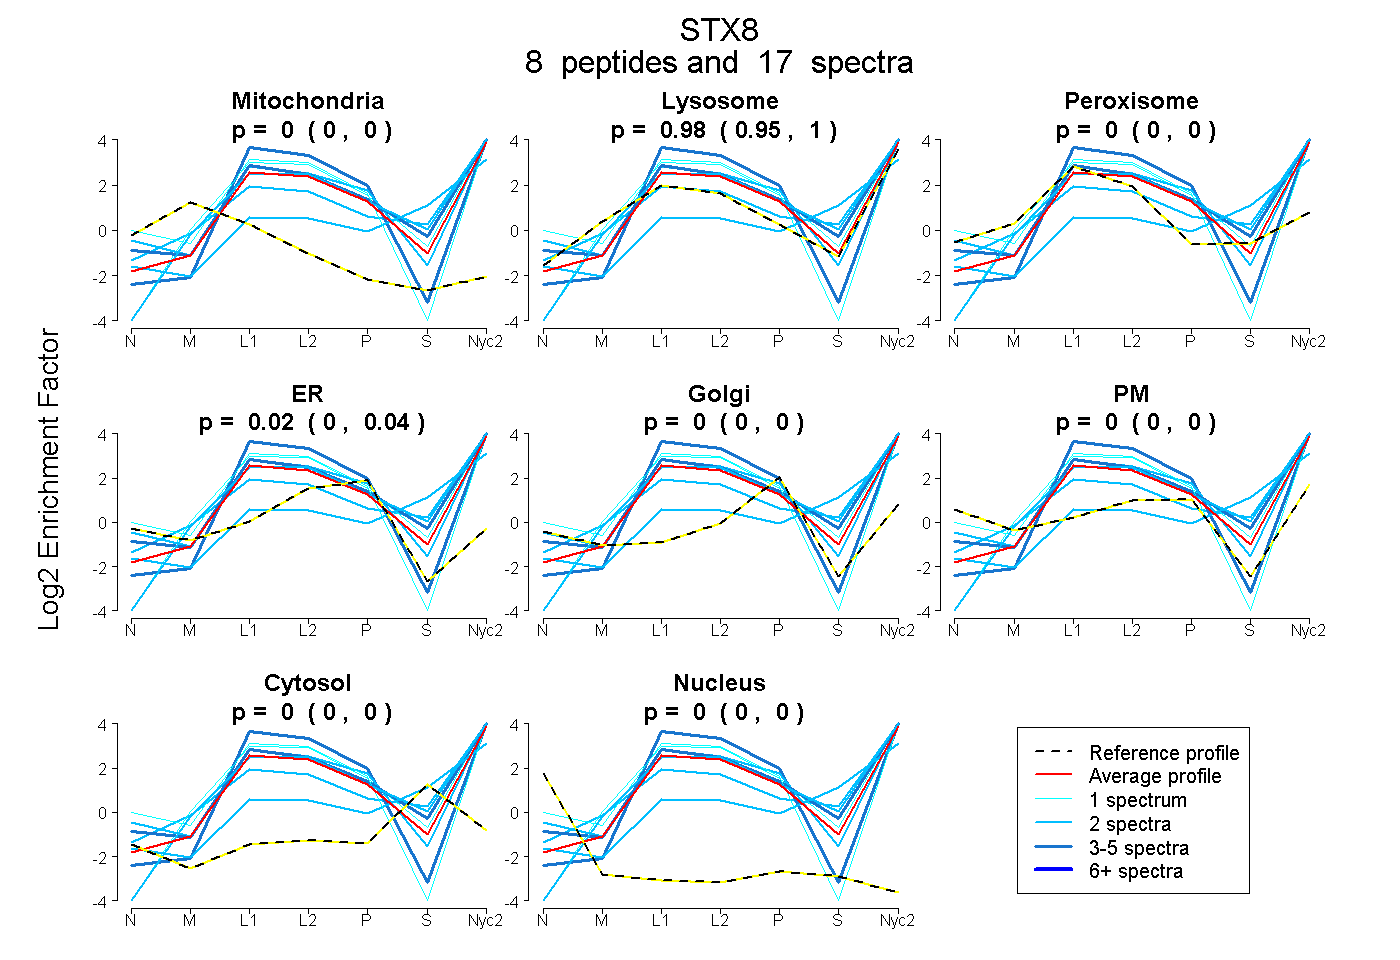
| Expt A |
8 peptides |
17 spectra |
|
0.000 0.000 | 0.000 |
0.983 0.955 | 1.000 |
0.000 0.000 | 0.000 |
0.017 0.000 | 0.039 |
0.000 0.000 | 0.000 |
0.000 0.000 | 0.000 |
0.000 0.000 | 0.000 |
0.000 0.000 | 0.000 |
| 3 spectra, NEGSEPDLIR | 0.000 | 0.990 | 0.010 | 0.000 | 0.000 | 0.000 | 0.000 | 0.000 | ||
| 2 spectra, QITQLEGDR | 0.000 | 0.593 | 0.000 | 0.000 | 0.000 | 0.000 | 0.407 | 0.000 | ||
| 1 spectrum, QNLLDDLVTR | 0.000 | 0.644 | 0.000 | 0.000 | 0.000 | 0.356 | 0.000 | 0.000 | ||
| 2 spectra, GLGFDEIR | 0.000 | 0.960 | 0.000 | 0.000 | 0.000 | 0.000 | 0.040 | 0.000 | ||
| 2 spectra, VTLVDR | 0.000 | 1.000 | 0.000 | 0.000 | 0.000 | 0.000 | 0.000 | 0.000 | ||
| 2 spectra, LTLTIR | 0.000 | 0.844 | 0.000 | 0.013 | 0.000 | 0.144 | 0.000 | 0.000 | ||
| 4 spectra, LLLASFK | 0.000 | 0.892 | 0.000 | 0.108 | 0.000 | 0.000 | 0.000 | 0.000 | ||
| 1 spectrum, IIQEQDAGLDALSSIISR | 0.000 | 1.000 | 0.000 | 0.000 | 0.000 | 0.000 | 0.000 | 0.000 |
| Plot | Mito | Lyso or Perox | ER | Golgi | PM | Cytosol | Nucleus | ||||||
| Expt B |
4 peptides |
11 spectra |
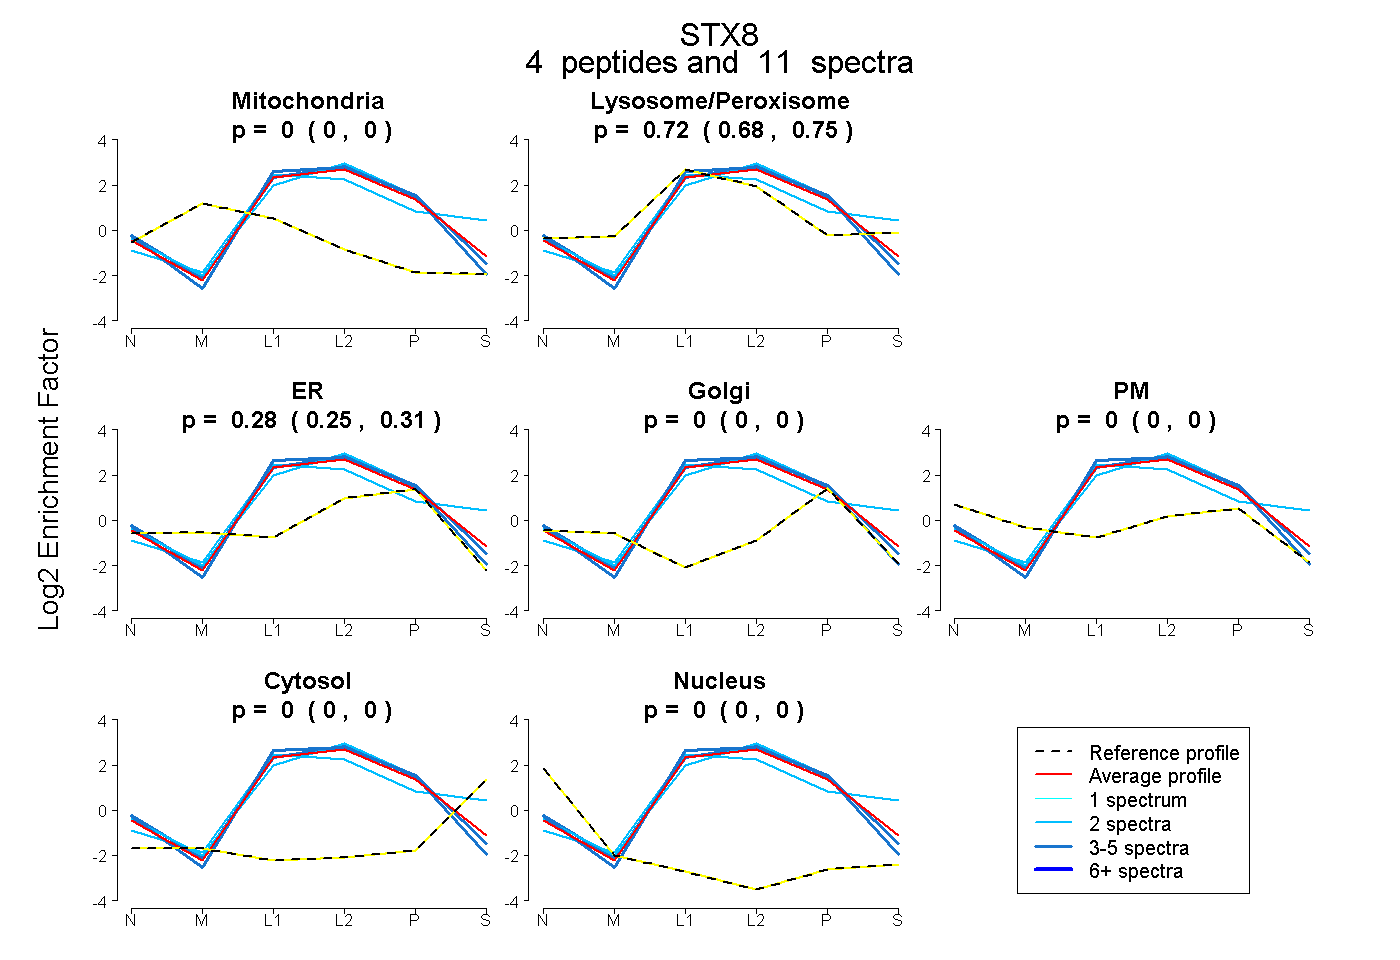 |
0.000 0.000 | 0.000 |
0.717 0.681 | 0.747 |
0.283 0.249 | 0.313 |
0.000 0.000 | 0.000 |
0.000 0.000 | 0.000 |
0.000 0.000 | 0.000 |
0.000 0.000 | 0.000 |
|||
| Plot | Lyso | Other | |||||||||||
| Expt C |
7 peptides |
55 spectra |
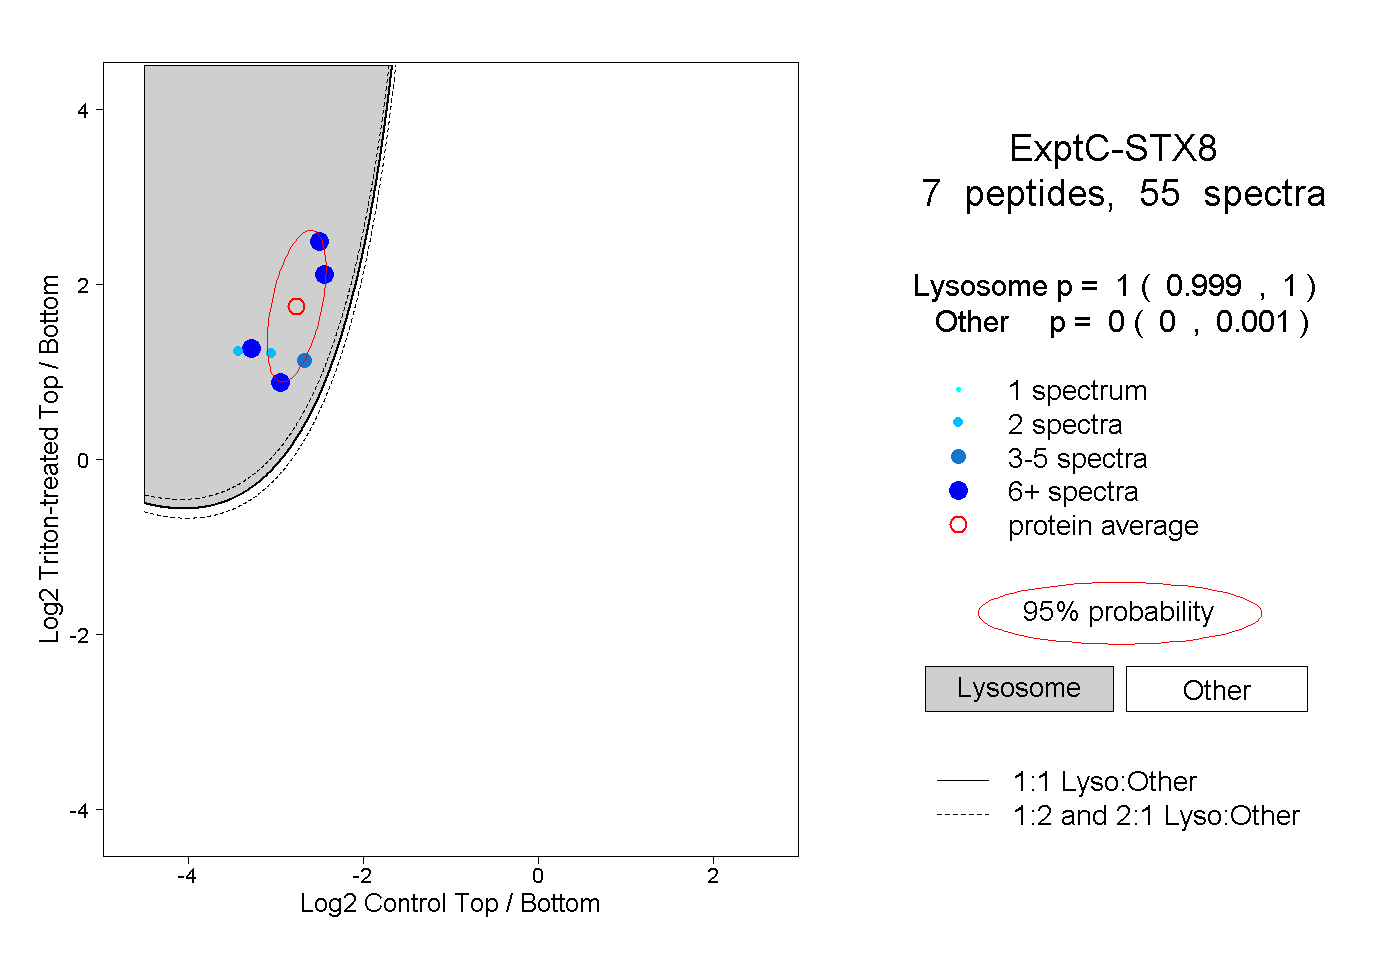 |
1.000 0.999 | 1.000 |
0.000 0.000 | 0.001 |
||||||||
| Plot | Lyso | Other | |||||||||||
| Expt D |
2 peptides |
2 spectra |
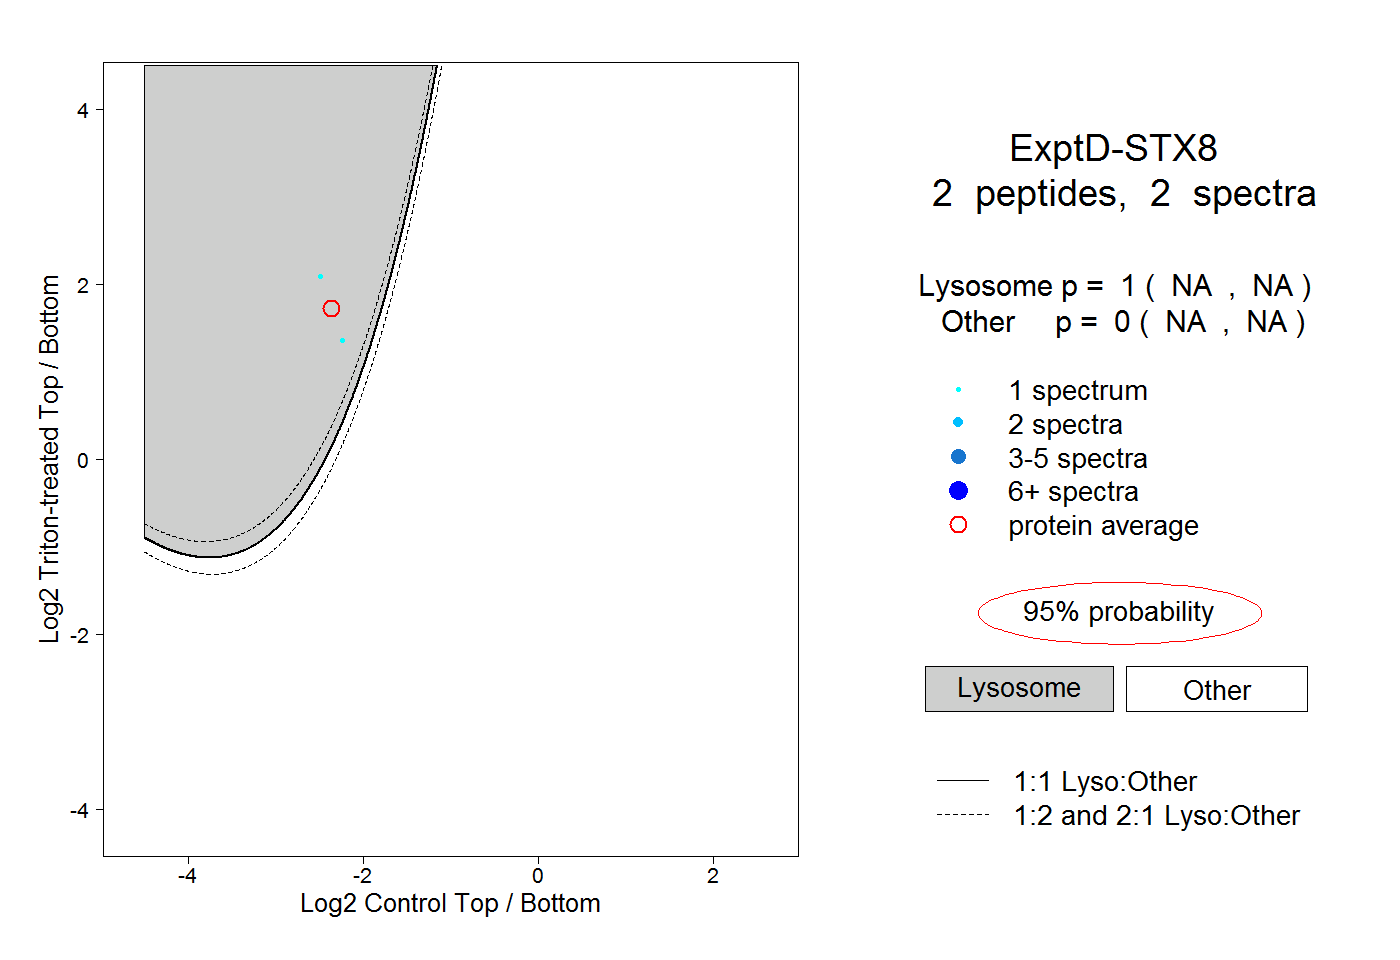 |
1.000 NA | NA |
0.000 NA | NA |