 3
3peptides
spectra
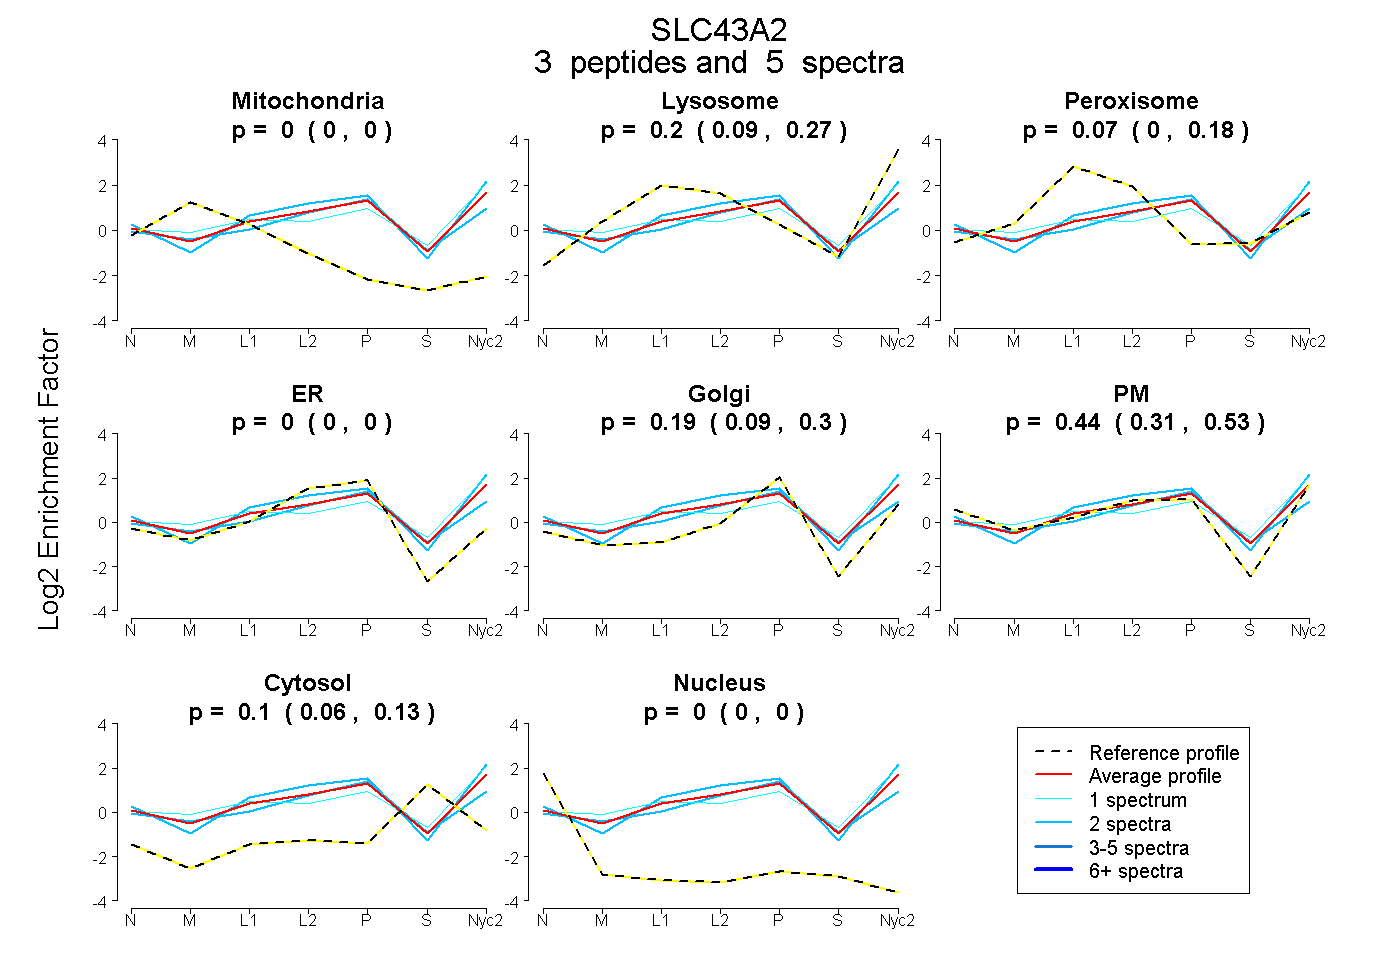
0.000 | 0.000
0.093 | 0.272
0.000 | 0.178
0.000 | 0.000
0.086 | 0.298
0.309 | 0.525
0.059 | 0.127
0.000 | 0.000
2peptides
spectra
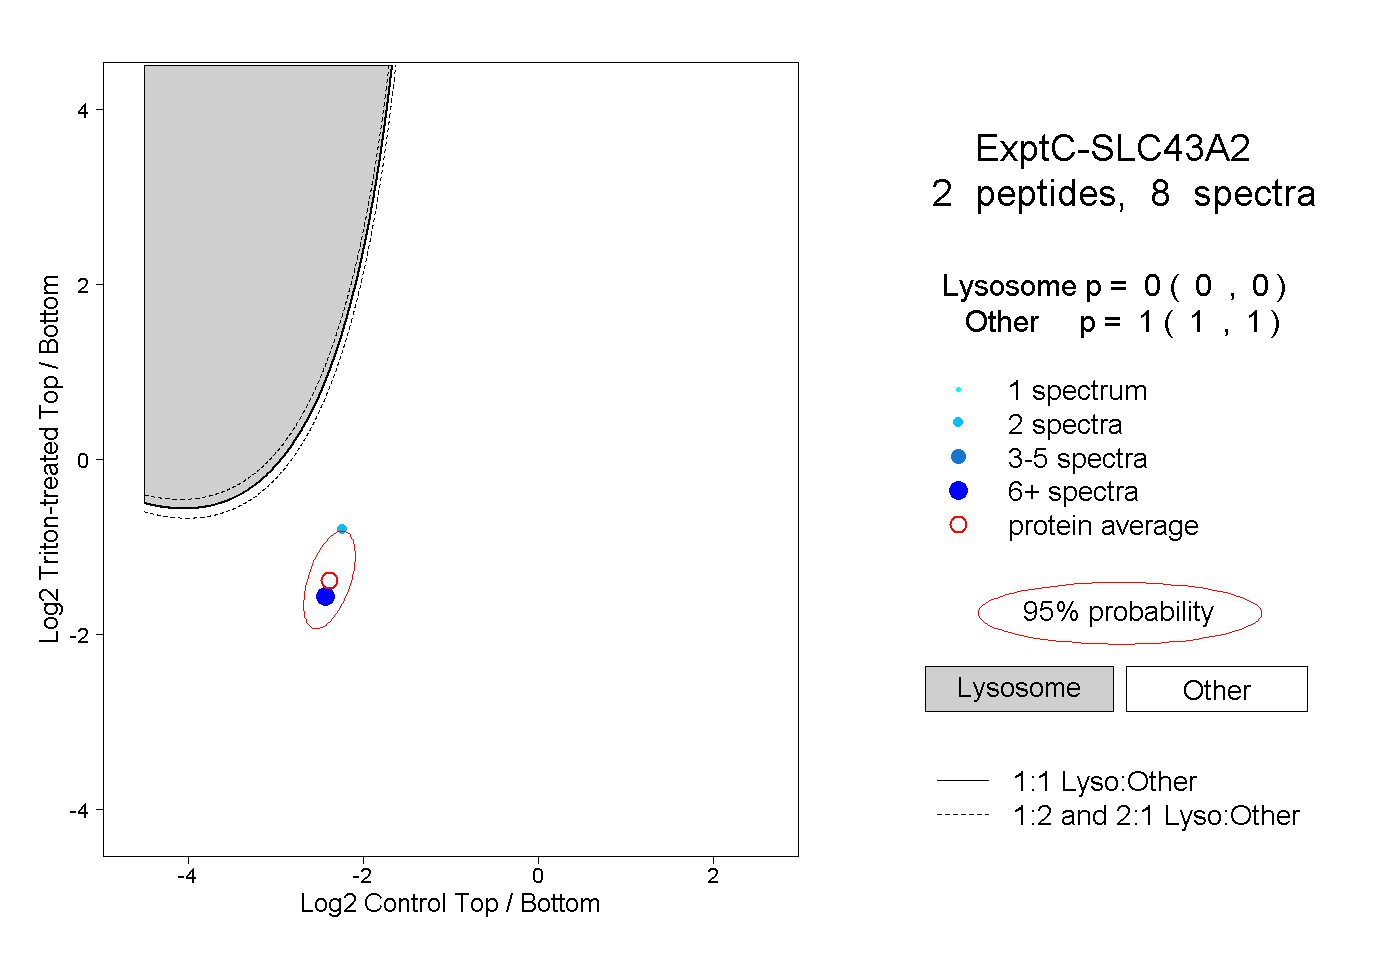
0.000 | 0.000
1.000 | 1.000
1peptide
spectrum
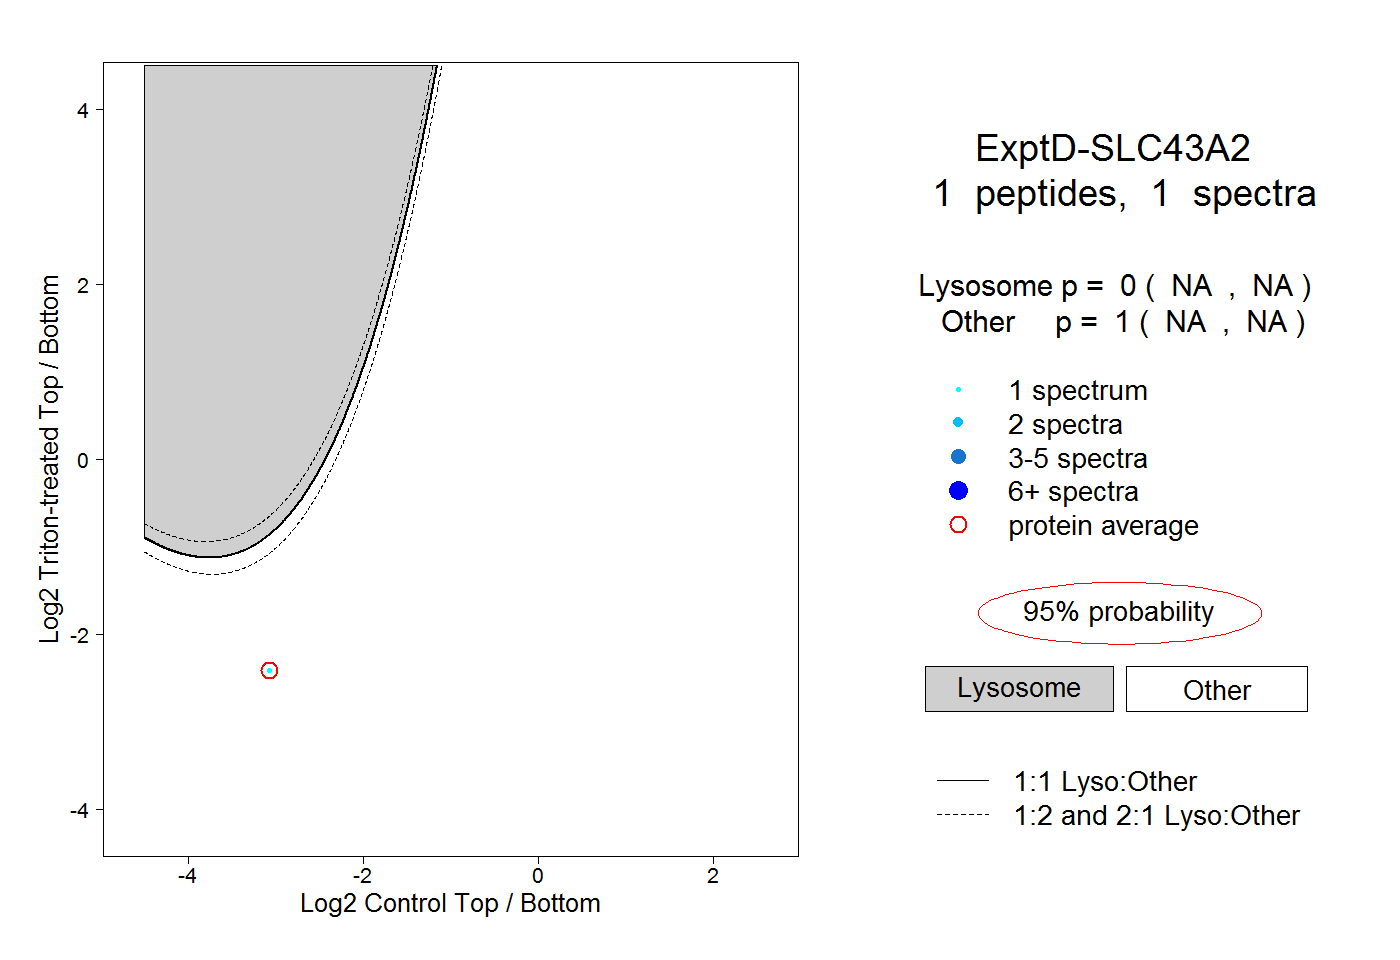
NA | NA
NA | NA