 3
3peptides
spectra
0.000 | 0.000
0.093 | 0.272
0.000 | 0.178
0.000 | 0.000
0.086 | 0.298
0.309 | 0.525
0.059 | 0.127
0.000 | 0.000
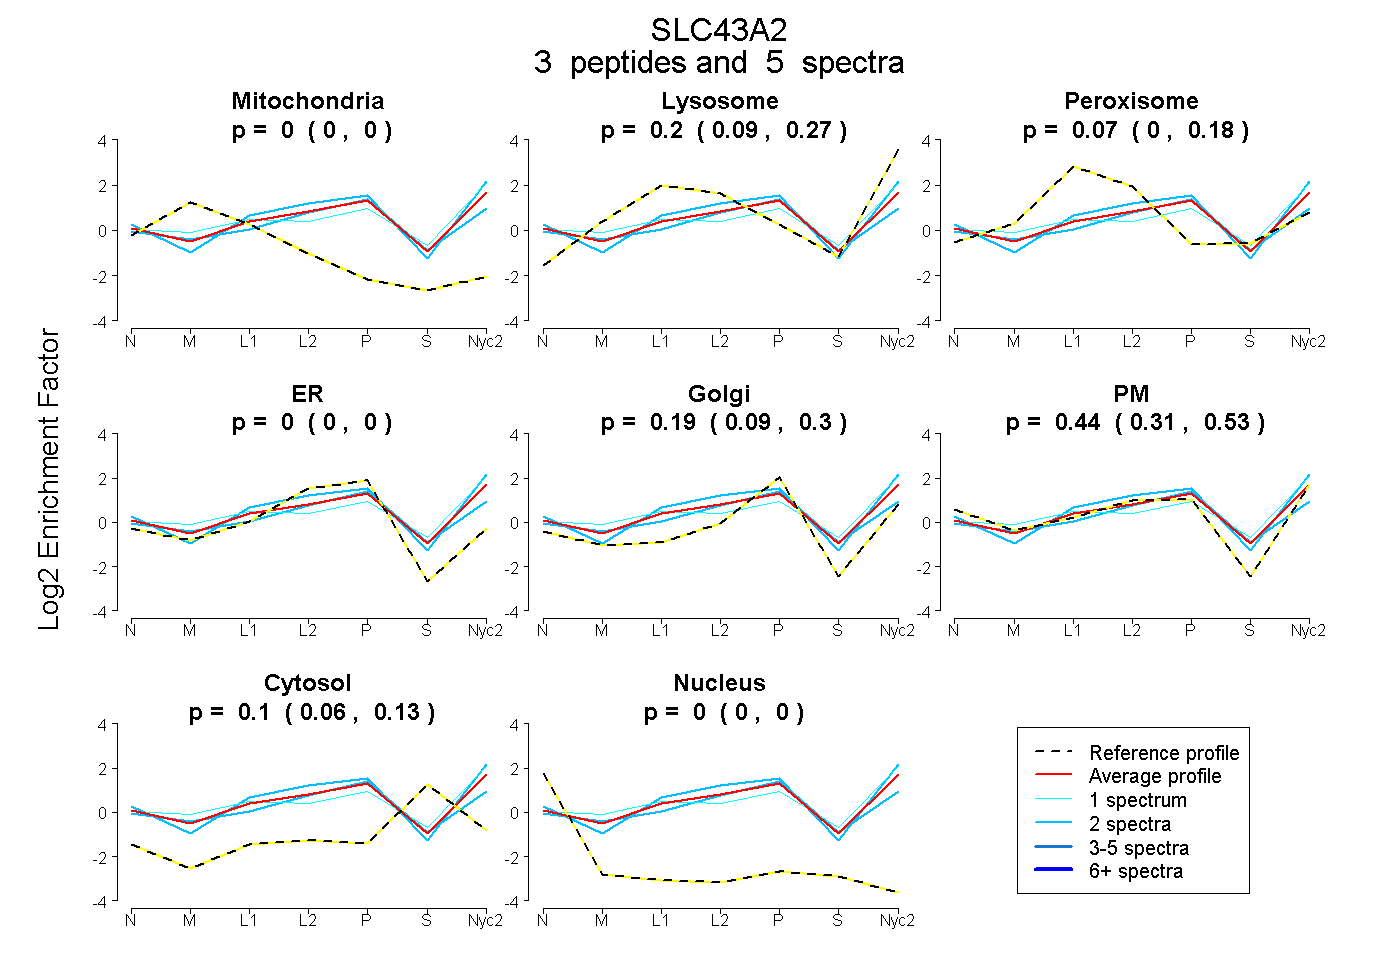
| Plot | Mito | Lyso | Perox | ER | Golgi | PM | Cytosol | Nucleus | |||||
| Expt A |
3 peptides |
5 spectra |
|
0.000 0.000 | 0.000 |
0.195 0.093 | 0.272 |
0.073 0.000 | 0.178 |
0.000 0.000 | 0.000 |
0.193 0.086 | 0.298 |
0.440 0.309 | 0.525 |
0.098 0.059 | 0.127 |
0.000 0.000 | 0.000 |
| 1 spectrum, FSWLGFDHK | 0.000 | 0.318 | 0.000 | 0.000 | 0.028 | 0.490 | 0.163 | 0.000 | ||
| 2 spectra, EQAALQEGHK | 0.000 | 0.247 | 0.000 | 0.023 | 0.086 | 0.596 | 0.048 | 0.000 | ||
| 2 spectra, APTLATAHR | 0.000 | 0.022 | 0.241 | 0.000 | 0.451 | 0.198 | 0.087 | 0.000 |
| Plot | Lyso | Other | |||||||||||
| Expt C |
2 peptides |
8 spectra |
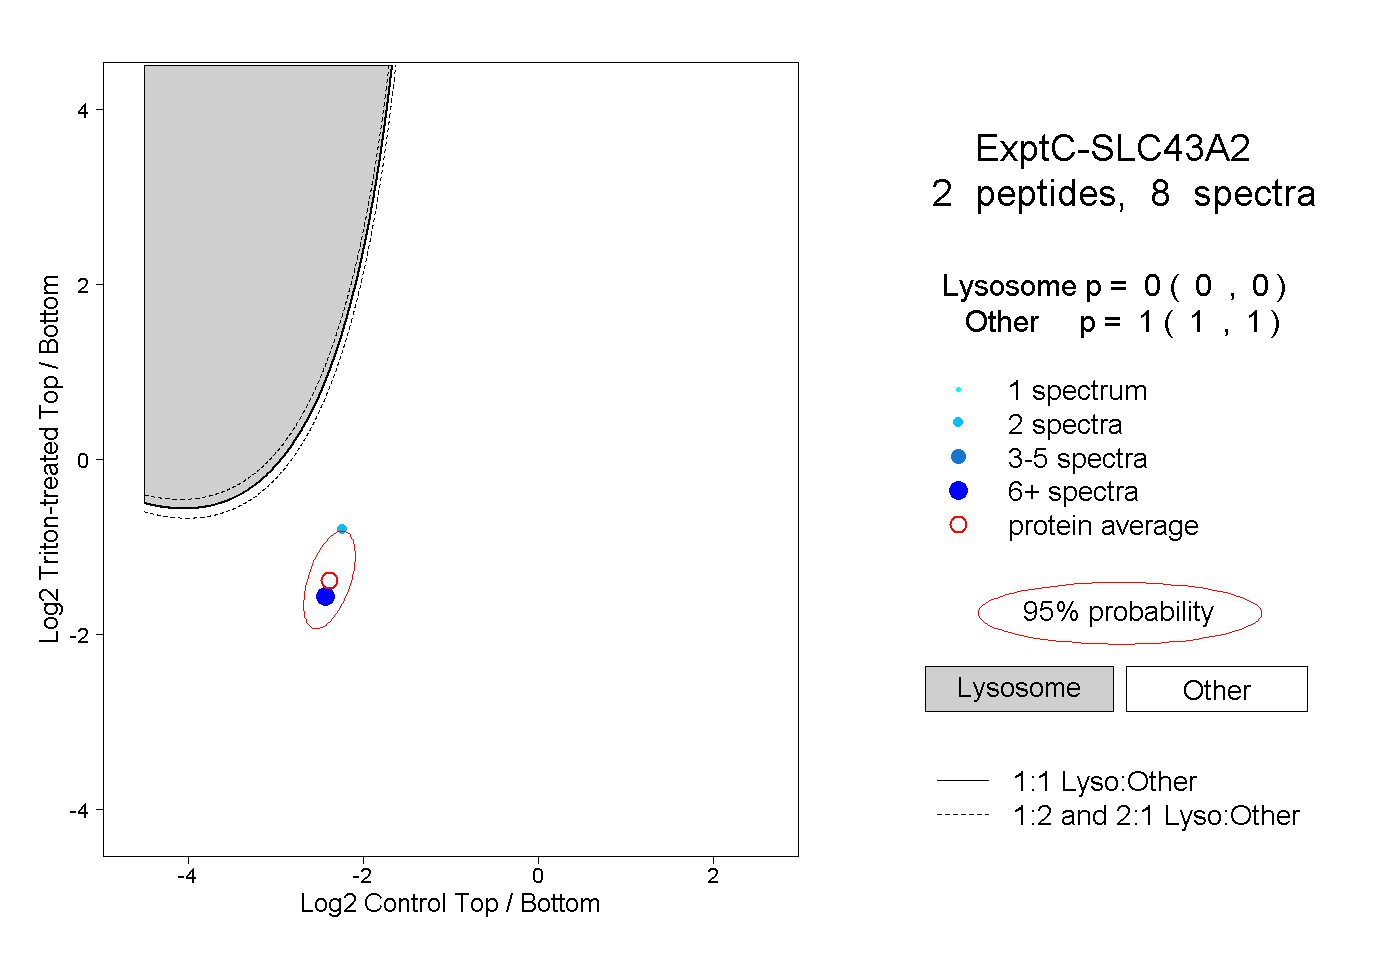 |
0.000 0.000 | 0.000 |
1.000 1.000 | 1.000 |
||||||||
| Plot | Lyso | Other | |||||||||||
| Expt D |
1 peptide |
1 spectrum |
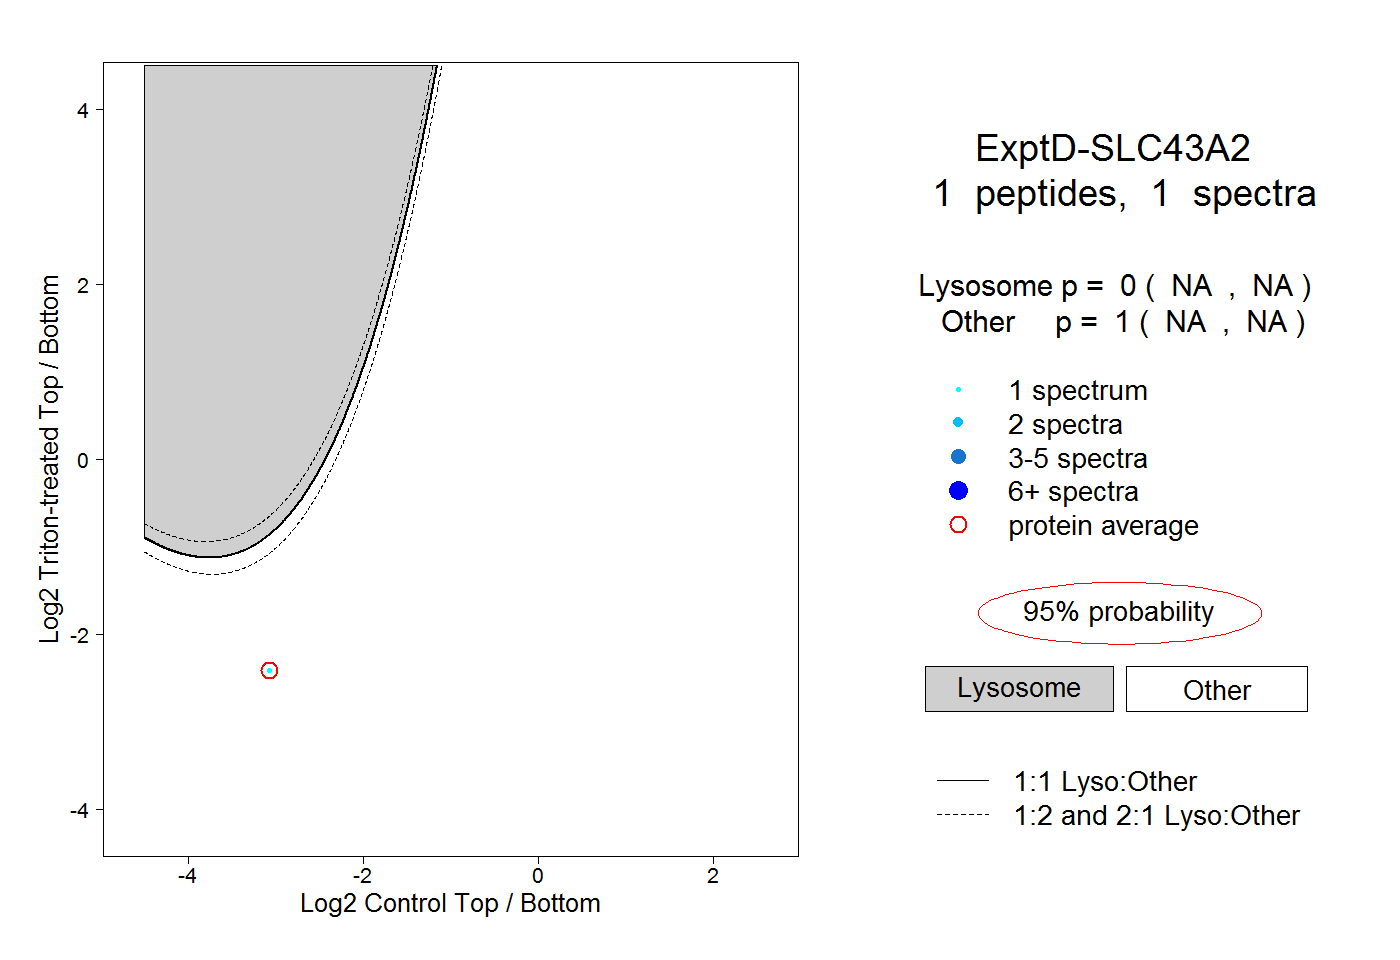 |
0.000 NA | NA |
1.000 NA | NA |