 8
8peptides
spectra
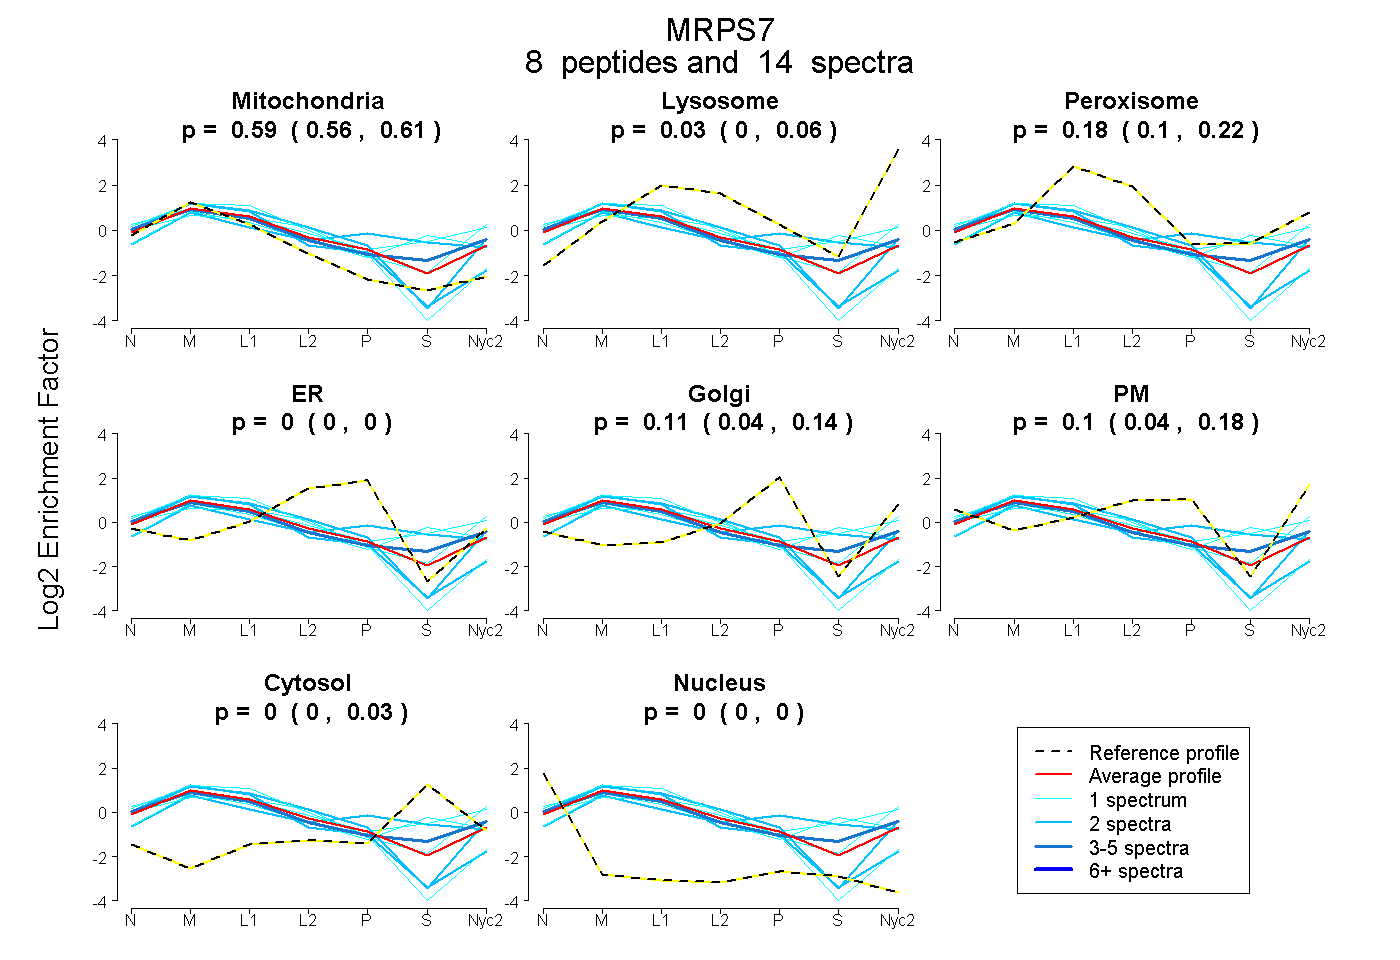
0.557 | 0.609
0.000 | 0.061
0.103 | 0.220
0.000 | 0.000
0.045 | 0.141
0.041 | 0.176
0.000 | 0.026
0.000 | 0.000
2peptides
spectra
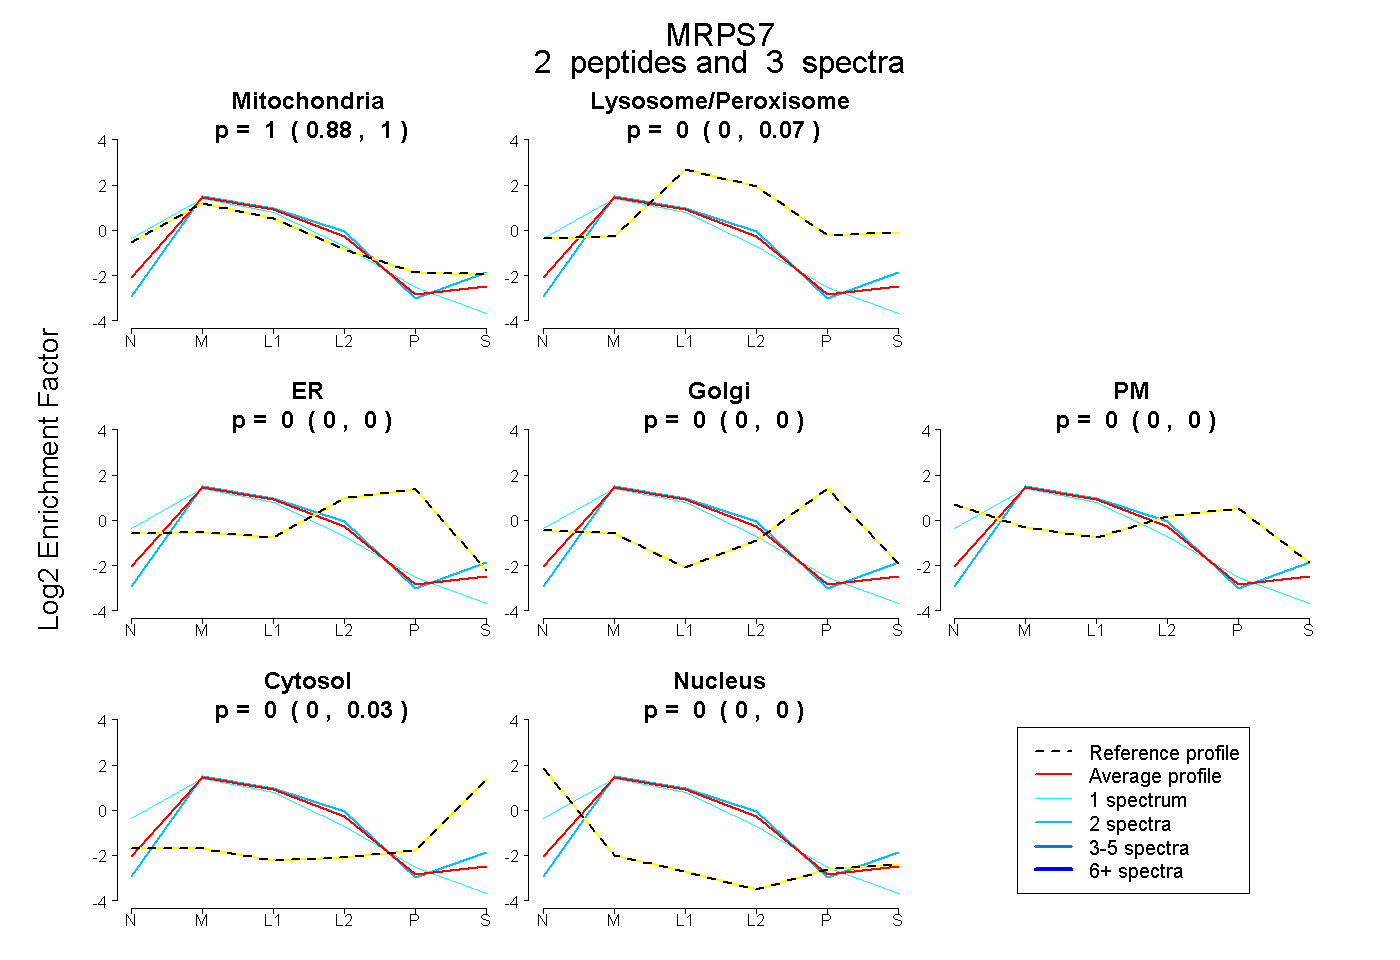
0.881 | 1.000
0.000 | 0.066
0.000 | 0.000
0.000 | 0.000
0.000 | 0.000
0.000 | 0.033
0.000 | 0.000
8peptides
spectra
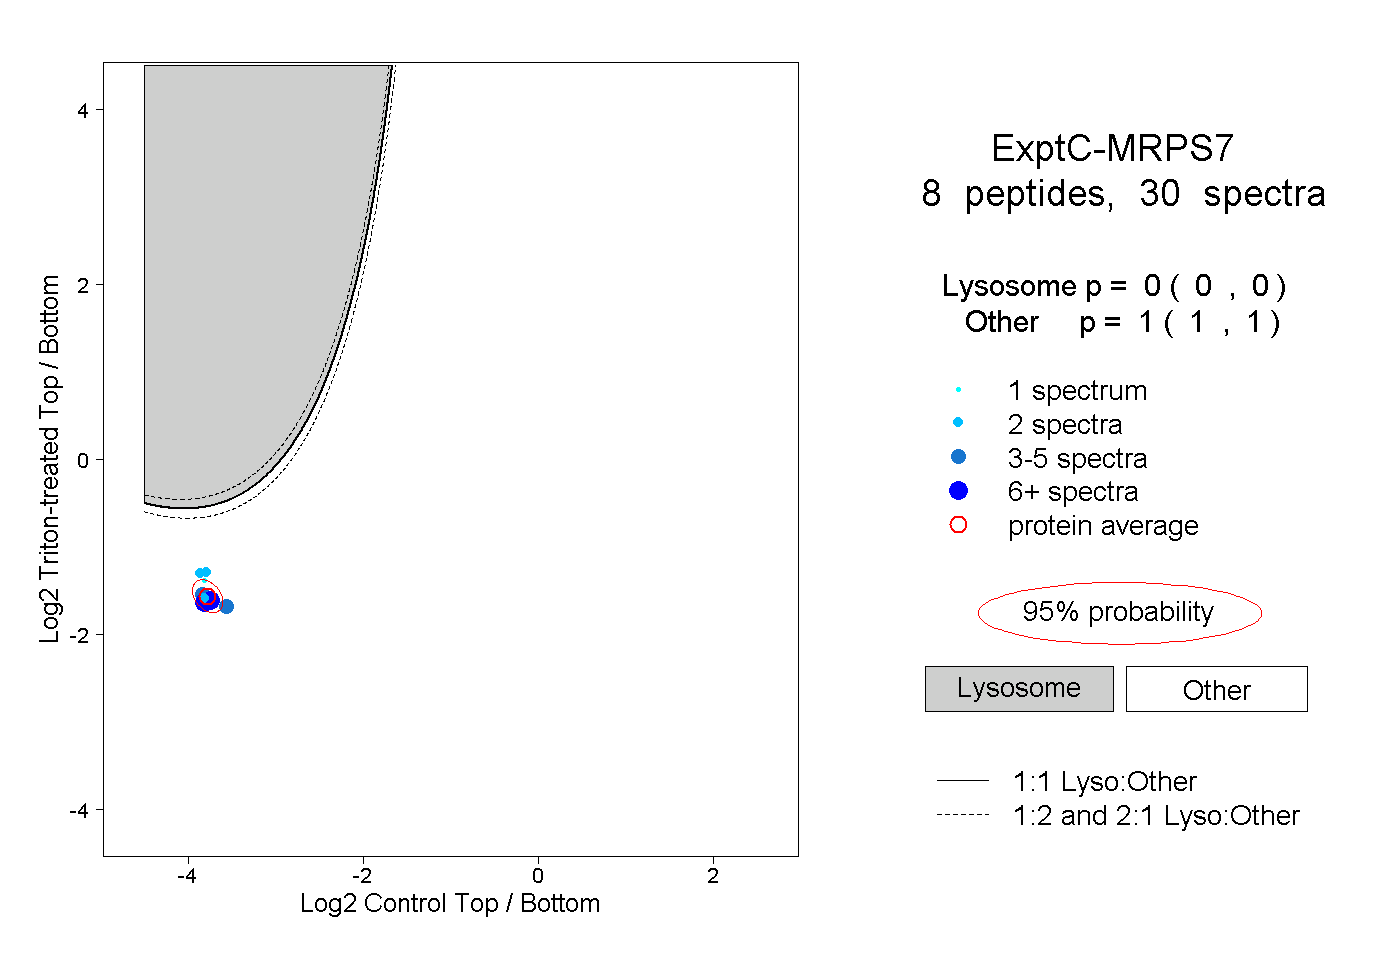
0.000 | 0.000
1.000 | 1.000
3peptides
spectra
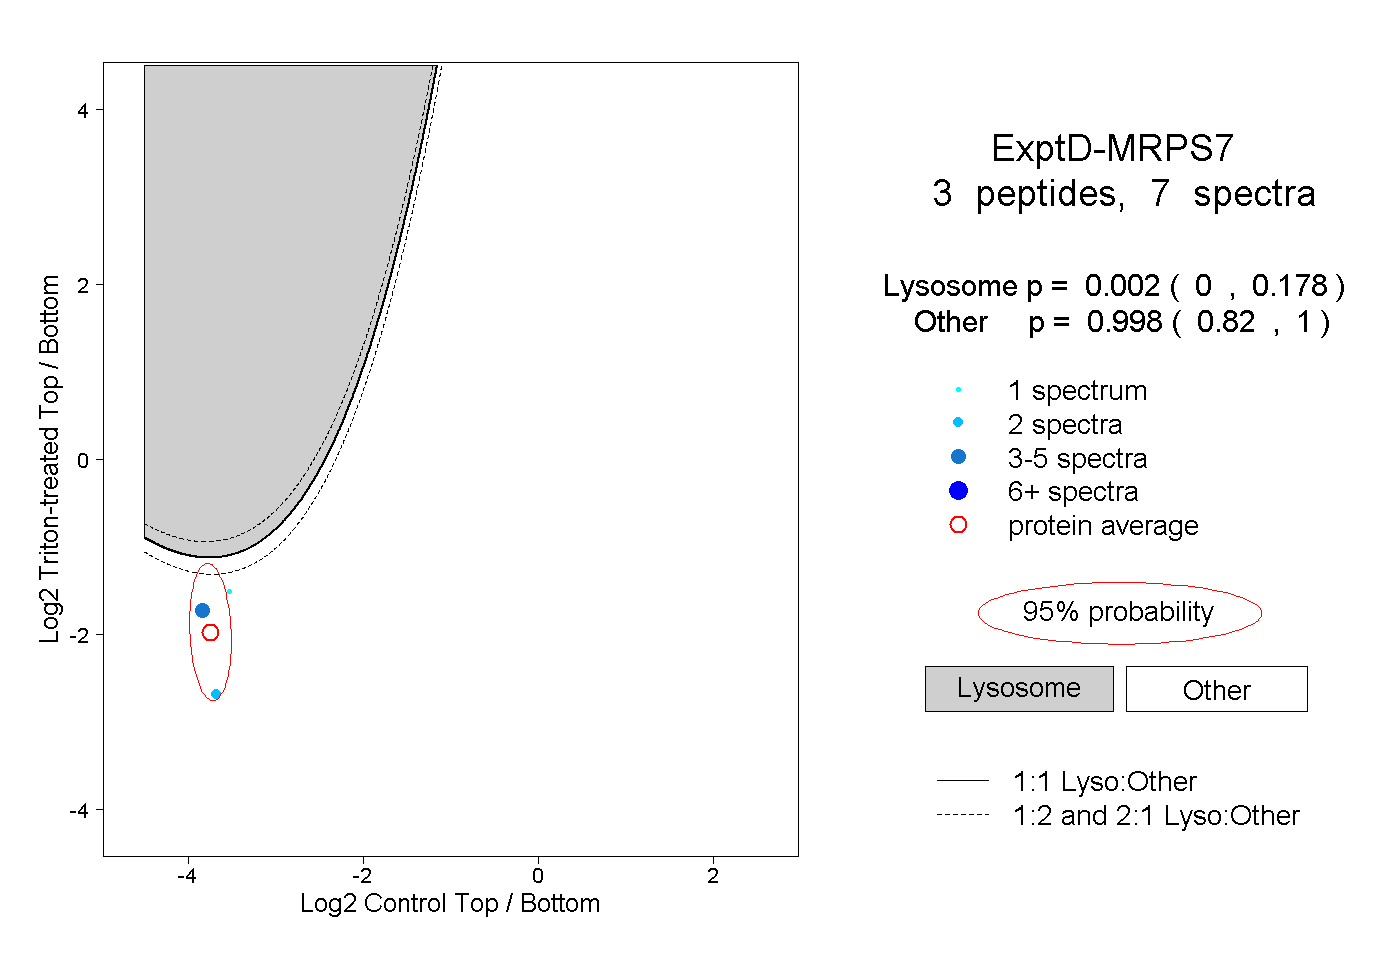
0.000 | 0.178
0.820 | 1.000