 8
8peptides
spectra
0.557 | 0.609
0.000 | 0.061
0.103 | 0.220
0.000 | 0.000
0.045 | 0.141
0.041 | 0.176
0.000 | 0.026
0.000 | 0.000
| Plot | Mito | Lyso | Perox | ER | Golgi | PM | Cytosol | Nucleus | |||||
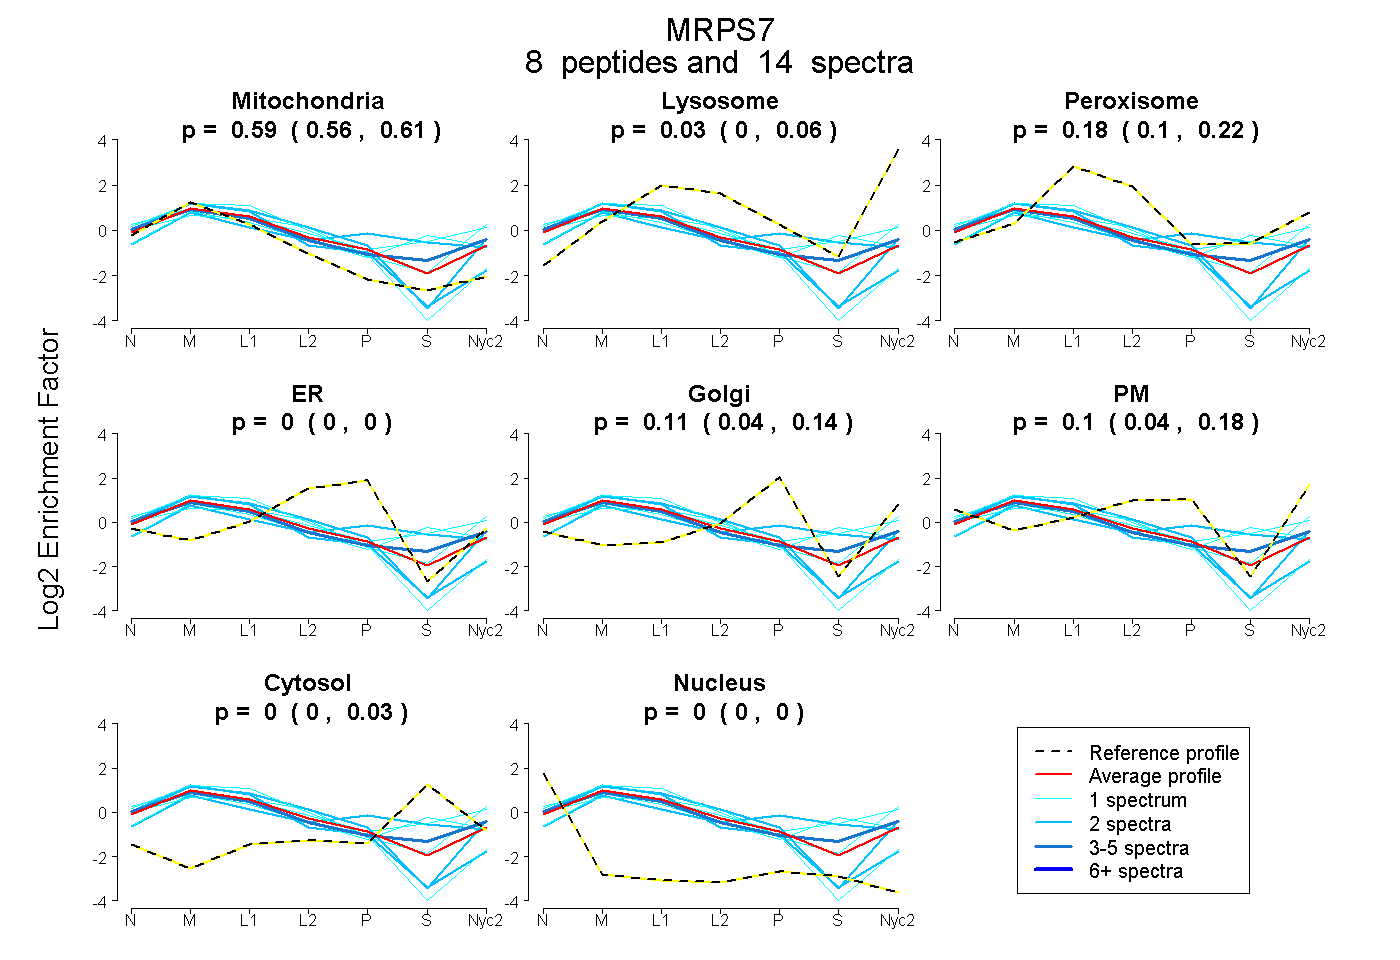
| Expt A |
8 peptides |
14 spectra |
|
0.587 0.557 | 0.609 |
0.028 0.000 | 0.061 |
0.175 0.103 | 0.220 |
0.000 0.000 | 0.000 |
0.109 0.045 | 0.141 |
0.100 0.041 | 0.176 |
0.000 0.000 | 0.026 |
0.000 0.000 | 0.000 |
| 2 spectra, LSHELLEAFHNR | 0.577 | 0.073 | 0.000 | 0.045 | 0.000 | 0.305 | 0.000 | 0.000 | ||
| 1 spectrum, MAEANR | 0.433 | 0.057 | 0.238 | 0.000 | 0.000 | 0.000 | 0.272 | 0.000 | ||
| 2 spectra, GGHFYQVPVPLADR | 0.366 | 0.000 | 0.229 | 0.000 | 0.203 | 0.000 | 0.203 | 0.000 | ||
| 4 spectra, WMITECR | 0.530 | 0.069 | 0.141 | 0.000 | 0.000 | 0.157 | 0.102 | 0.000 | ||
| 1 spectrum, NCEPVIGLVPILK | 0.747 | 0.000 | 0.000 | 0.253 | 0.000 | 0.000 | 0.000 | 0.000 | ||
| 1 spectrum, AASAEEQATIER | 0.508 | 0.151 | 0.091 | 0.000 | 0.000 | 0.249 | 0.000 | 0.000 | ||
| 1 spectrum, IFHEALR | 0.326 | 0.095 | 0.246 | 0.000 | 0.000 | 0.129 | 0.205 | 0.000 | ||
| 2 spectra, ALAHYR | 0.797 | 0.000 | 0.000 | 0.203 | 0.000 | 0.000 | 0.000 | 0.000 |
| Plot | Mito | Lyso or Perox | ER | Golgi | PM | Cytosol | Nucleus | ||||||
| Expt B |
2 peptides |
3 spectra |
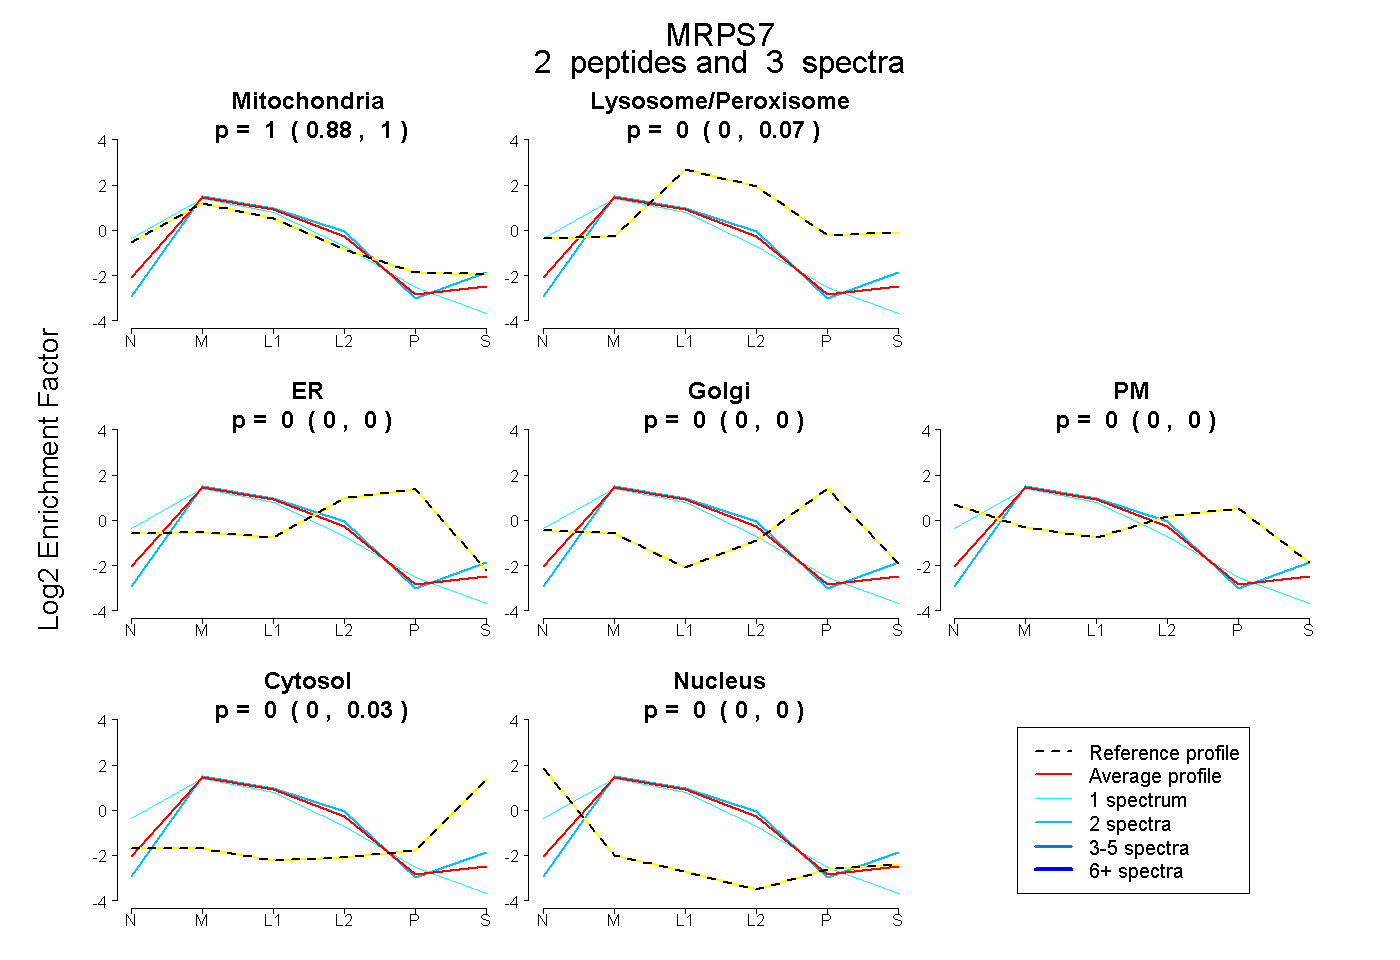 |
1.000 0.881 | 1.000 |
0.000 0.000 | 0.066 |
0.000 0.000 | 0.000 |
0.000 0.000 | 0.000 |
0.000 0.000 | 0.000 |
0.000 0.000 | 0.033 |
0.000 0.000 | 0.000 |
|||
| Plot | Lyso | Other | |||||||||||
| Expt C |
8 peptides |
30 spectra |
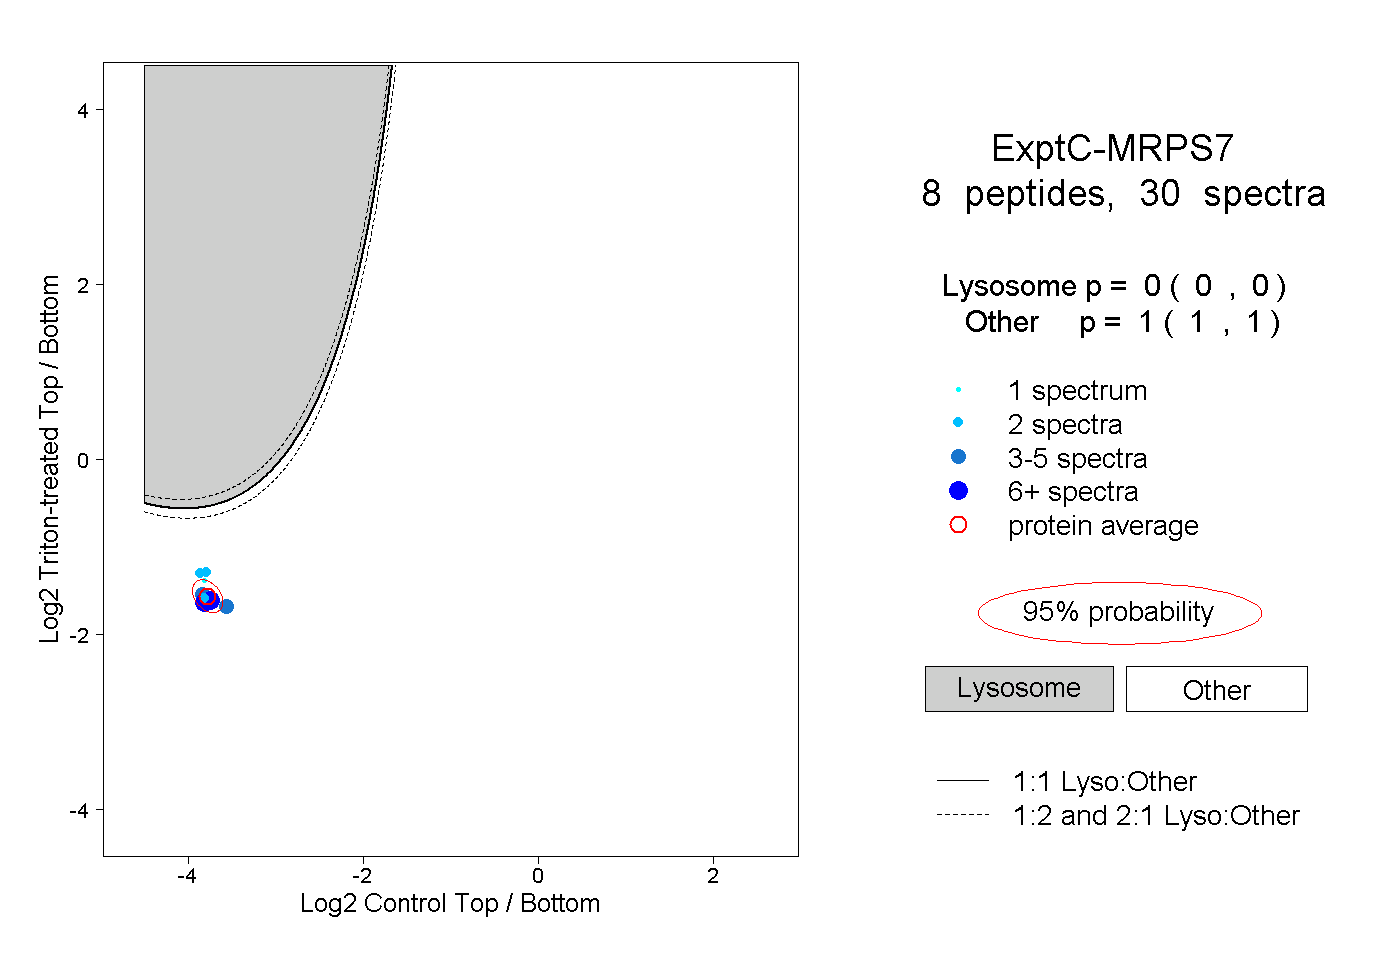 |
0.000 0.000 | 0.000 |
1.000 1.000 | 1.000 |
||||||||
| Plot | Lyso | Other | |||||||||||
| Expt D |
3 peptides |
7 spectra |
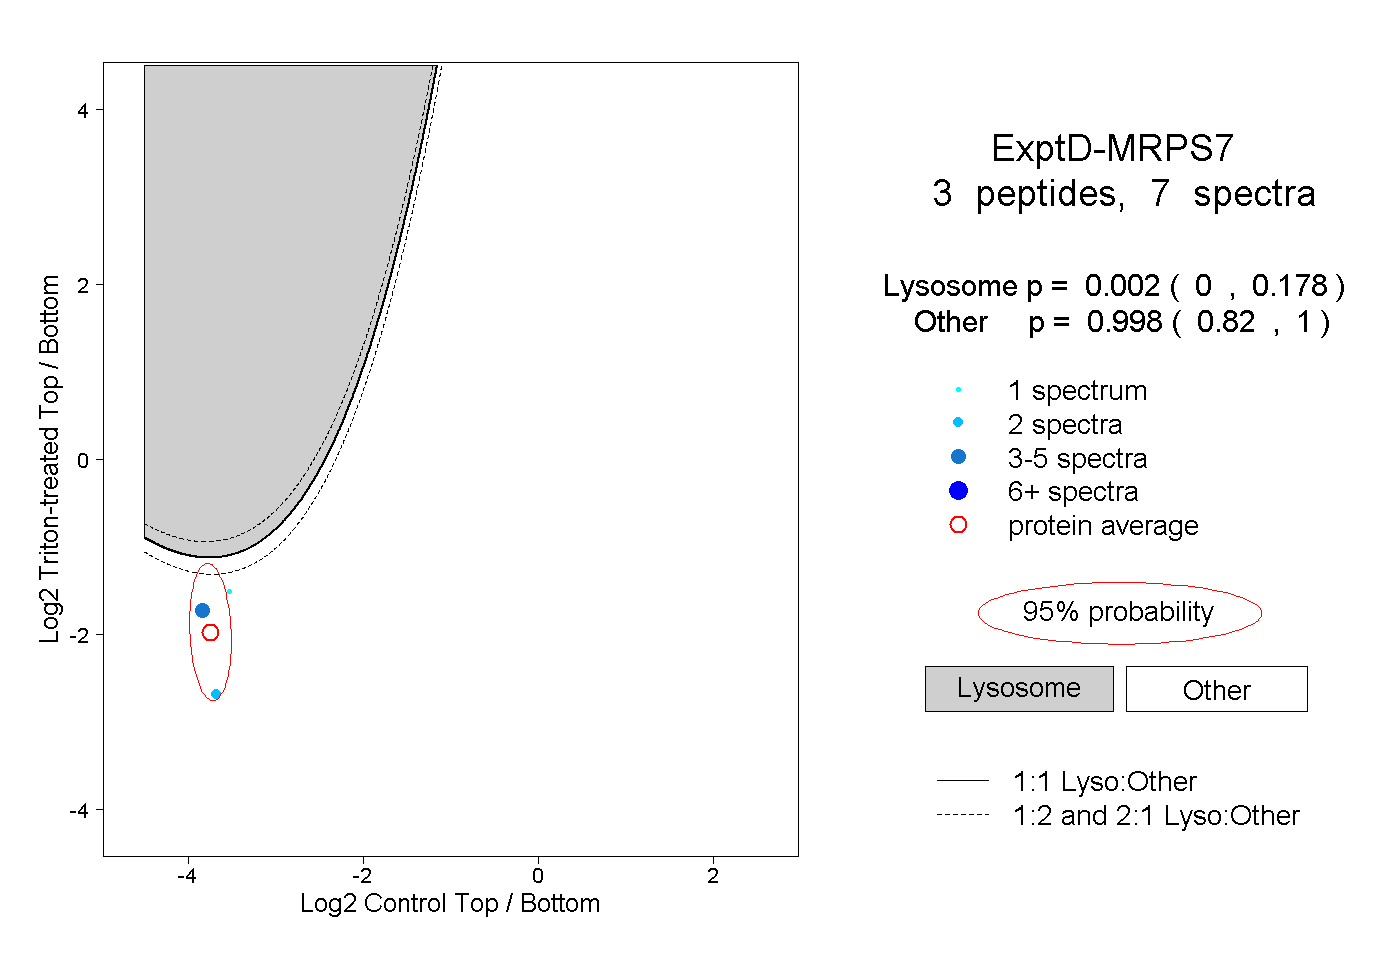 |
0.002 0.000 | 0.178 |
0.998 0.820 | 1.000 |