 3
3peptides
spectra
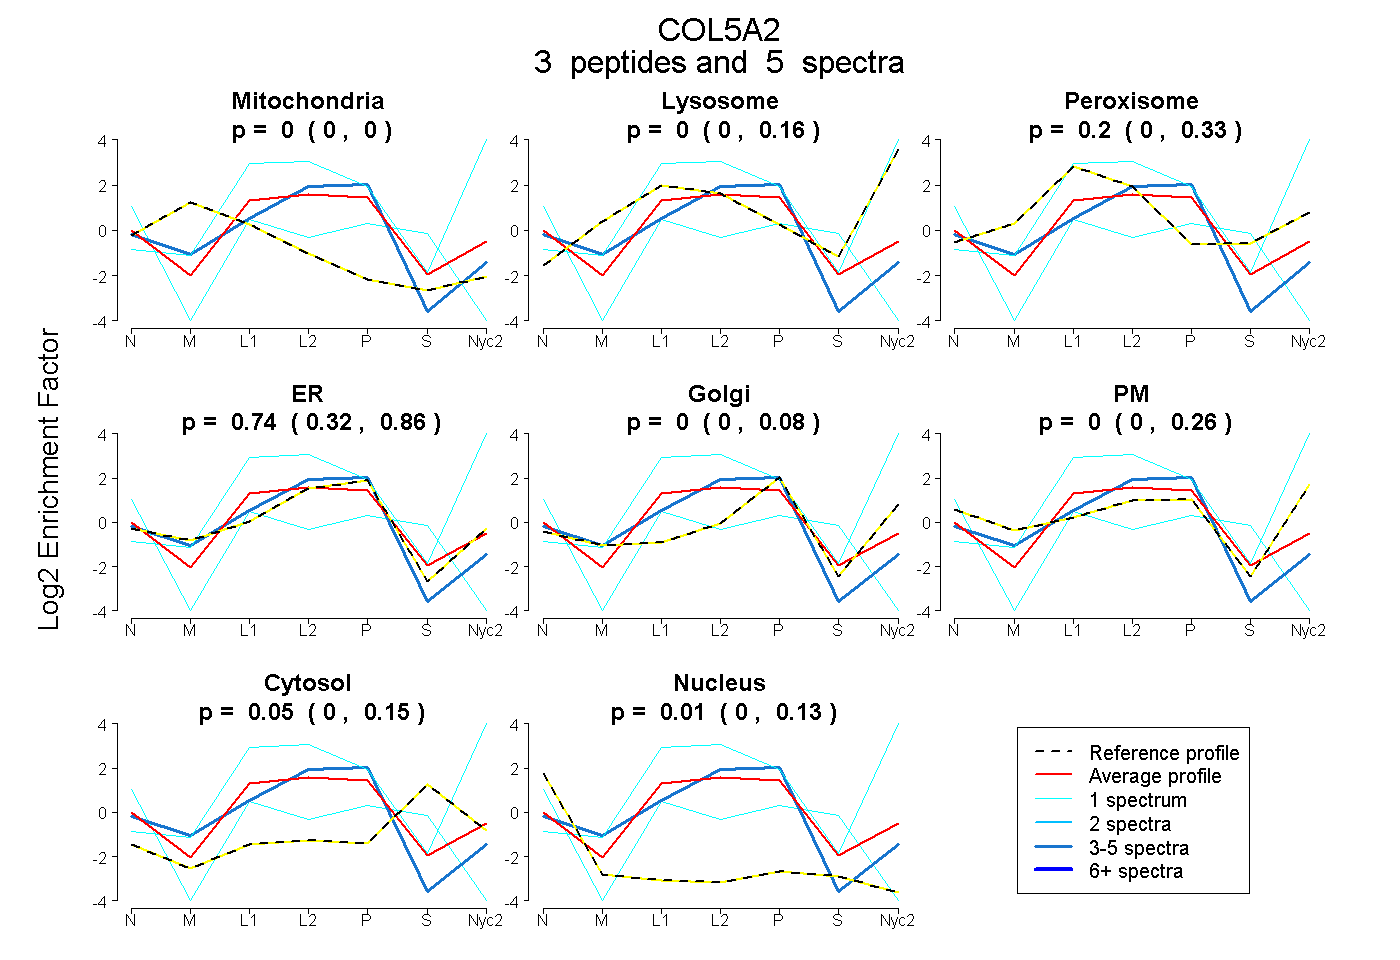
0.000 | 0.000
0.000 | 0.161
0.000 | 0.332
0.321 | 0.859
0.000 | 0.084
0.000 | 0.259
0.000 | 0.146
0.000 | 0.125
8peptides
spectra
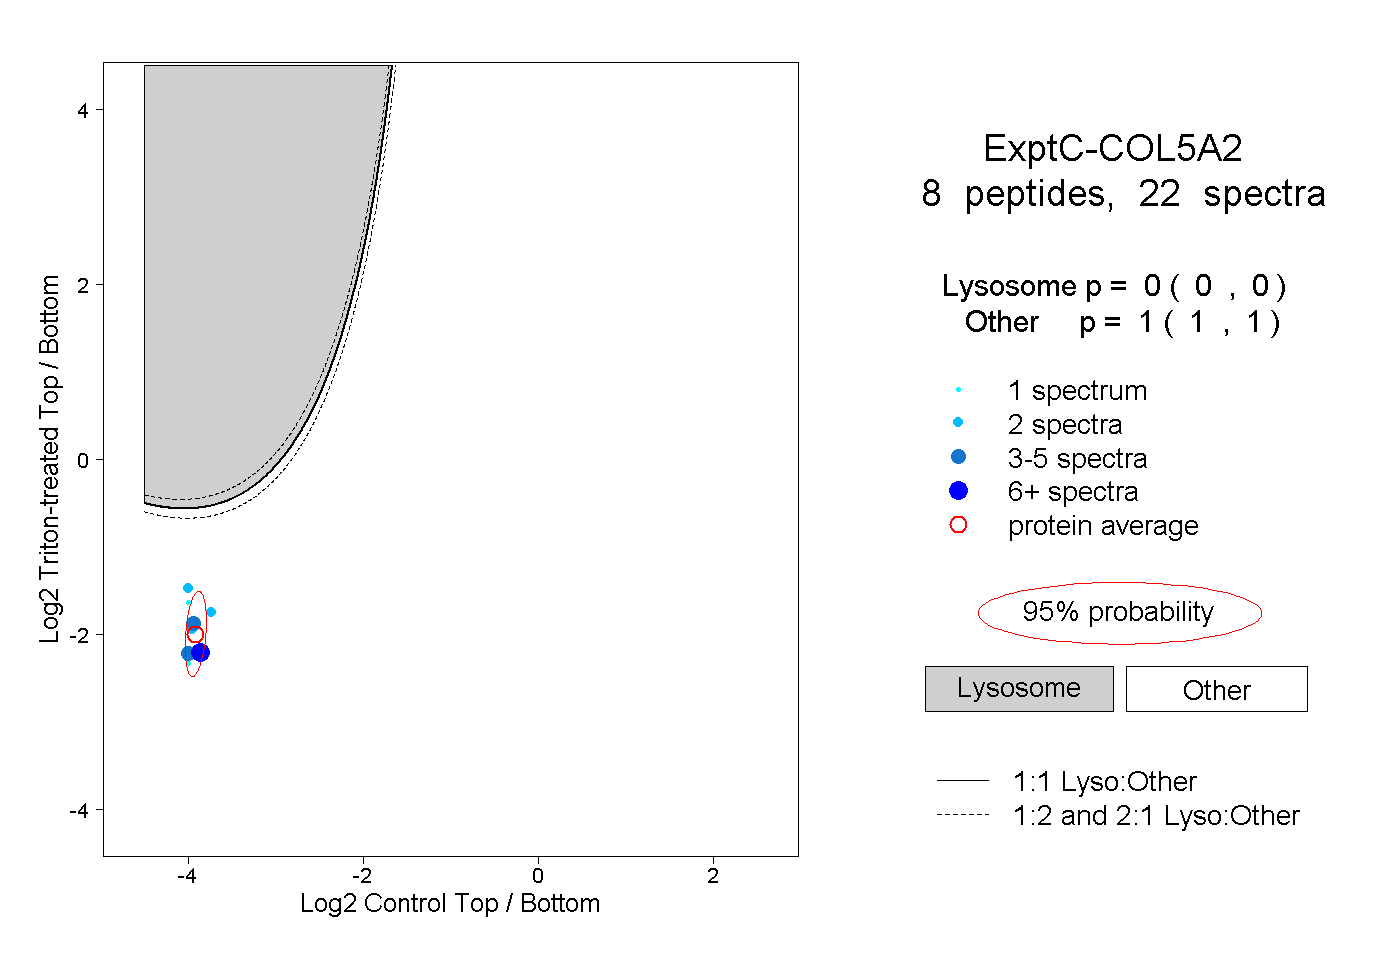
0.000 | 0.000
1.000 | 1.000
3peptides
spectra
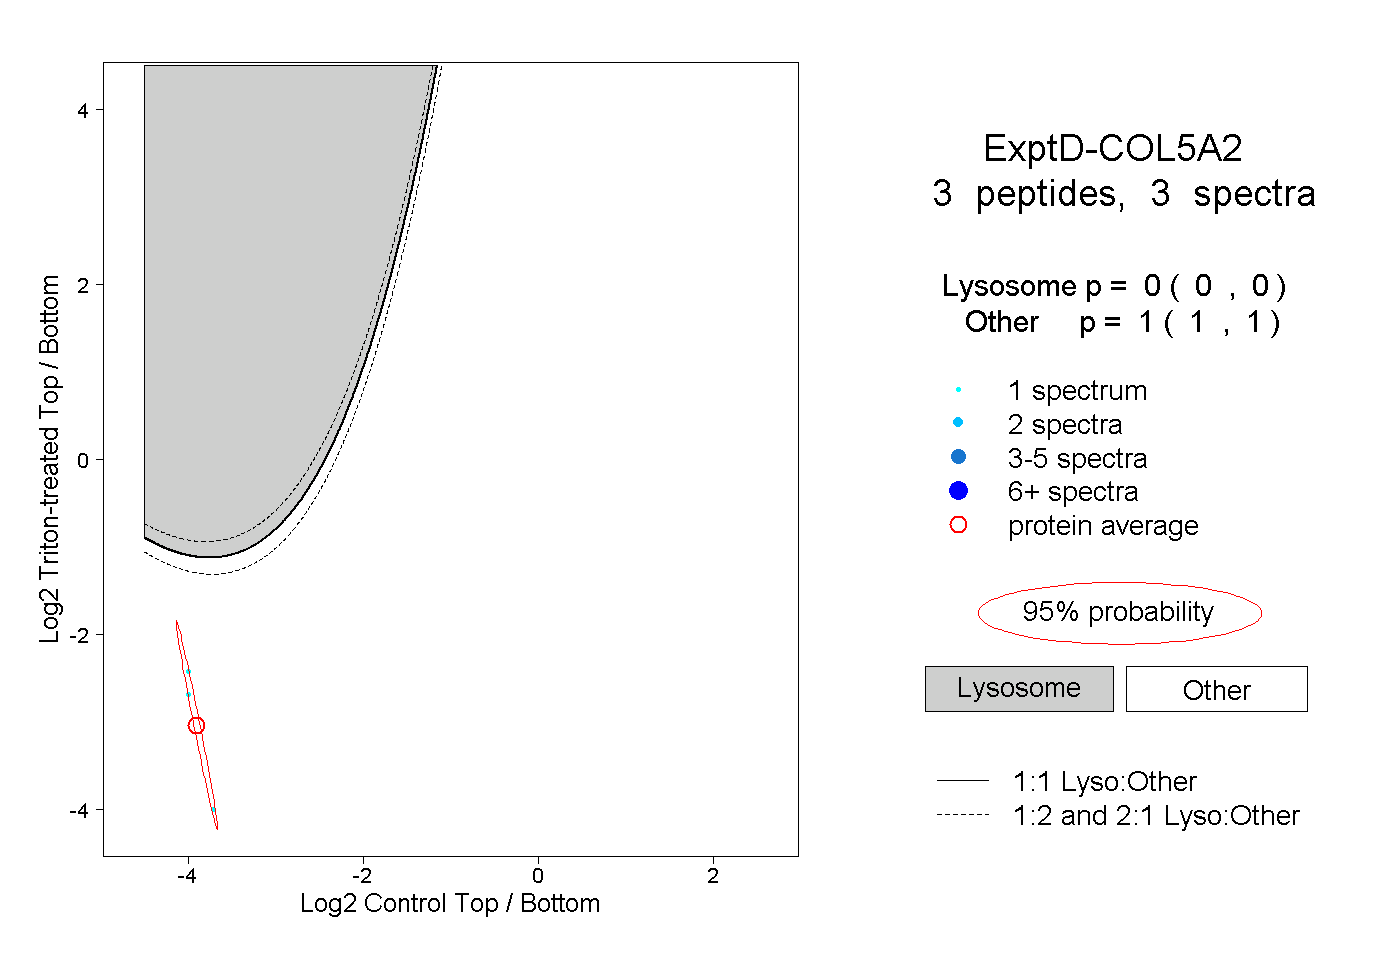
0.000 | 0.000
1.000 | 1.000