 3
3peptides
spectra
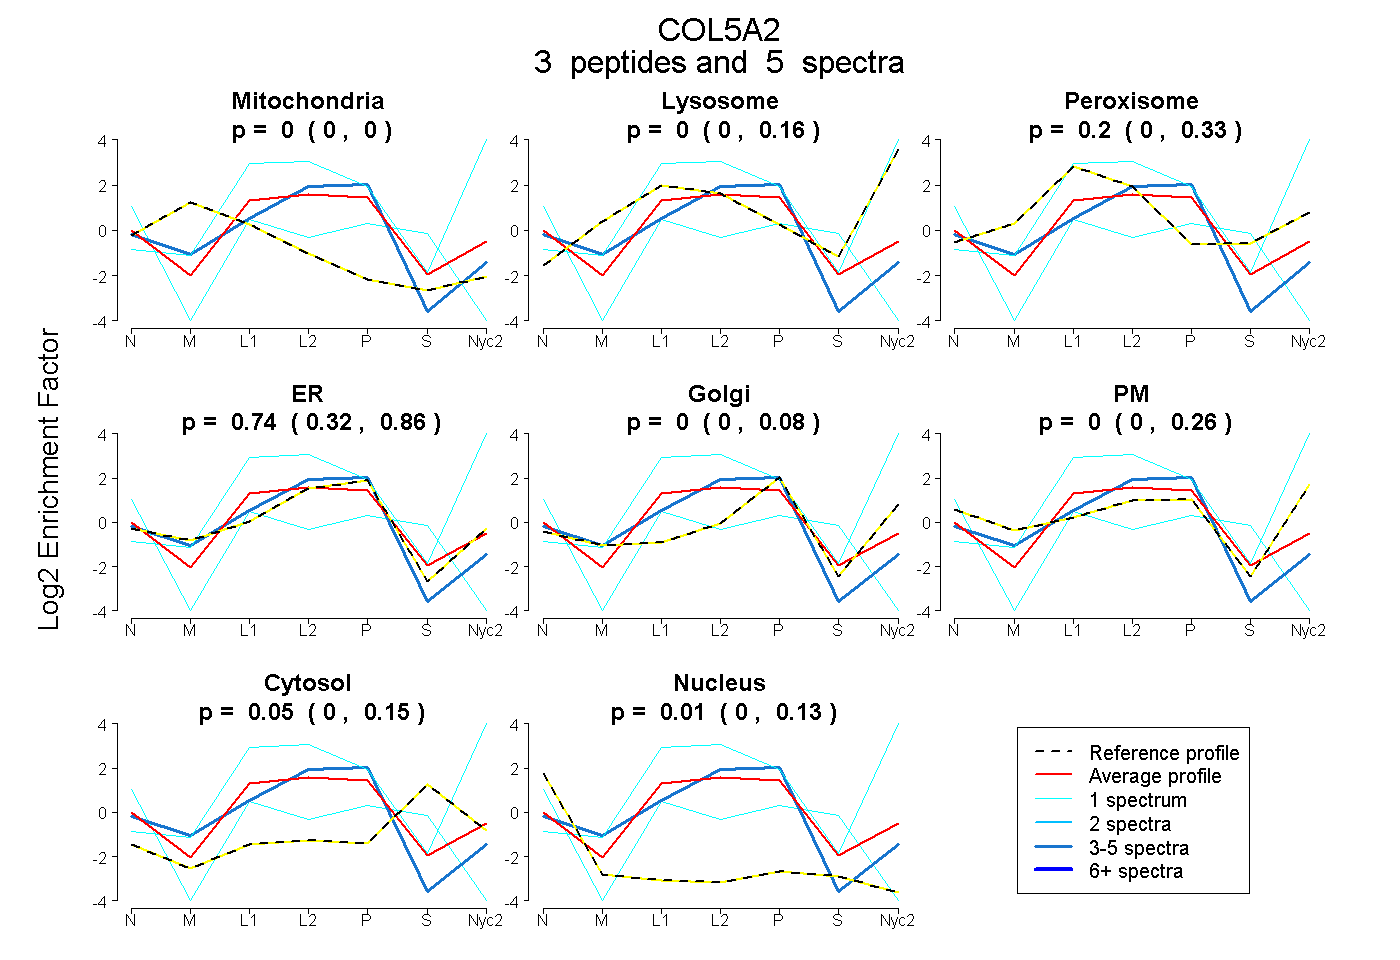
0.000 | 0.000
0.000 | 0.161
0.000 | 0.332
0.321 | 0.859
0.000 | 0.084
0.000 | 0.259
0.000 | 0.146
0.000 | 0.125
| Plot | Mito | Lyso | Perox | ER | Golgi | PM | Cytosol | Nucleus | |||||
| Expt A |
3 peptides |
5 spectra |
|
0.000 0.000 | 0.000 |
0.000 0.000 | 0.161 |
0.199 0.000 | 0.332 |
0.739 0.321 | 0.859 |
0.000 0.000 | 0.084 |
0.000 0.000 | 0.259 |
0.048 0.000 | 0.146 |
0.014 0.000 | 0.125 |
| 1 spectrum, DGEVGPSGPVGPPGLAGER | 0.000 | 0.000 | 0.042 | 0.290 | 0.000 | 0.000 | 0.330 | 0.338 | ||
| 3 spectra, GPVGPPGR | 0.000 | 0.000 | 0.000 | 0.988 | 0.000 | 0.000 | 0.000 | 0.012 | ||
| 1 spectrum, SPNTAITQMTFLR | 0.000 | 0.892 | 0.000 | 0.108 | 0.000 | 0.000 | 0.000 | 0.000 |
| Plot | Lyso | Other | |||||||||||
| Expt C |
8 peptides |
22 spectra |
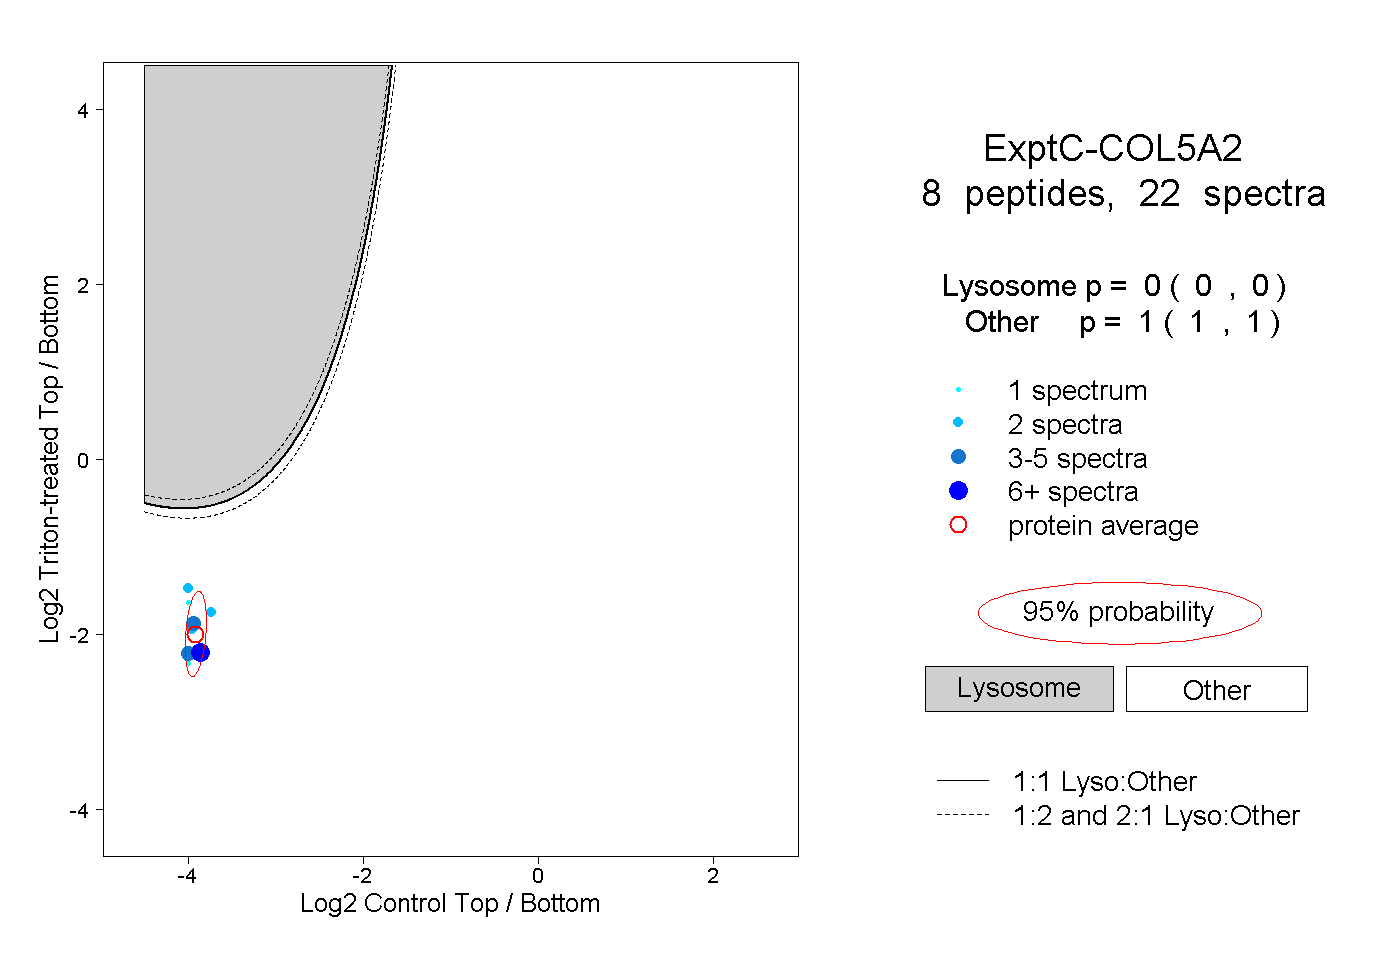 |
0.000 0.000 | 0.000 |
1.000 1.000 | 1.000 |
||||||||
| Plot | Lyso | Other | |||||||||||
| Expt D |
3 peptides |
3 spectra |
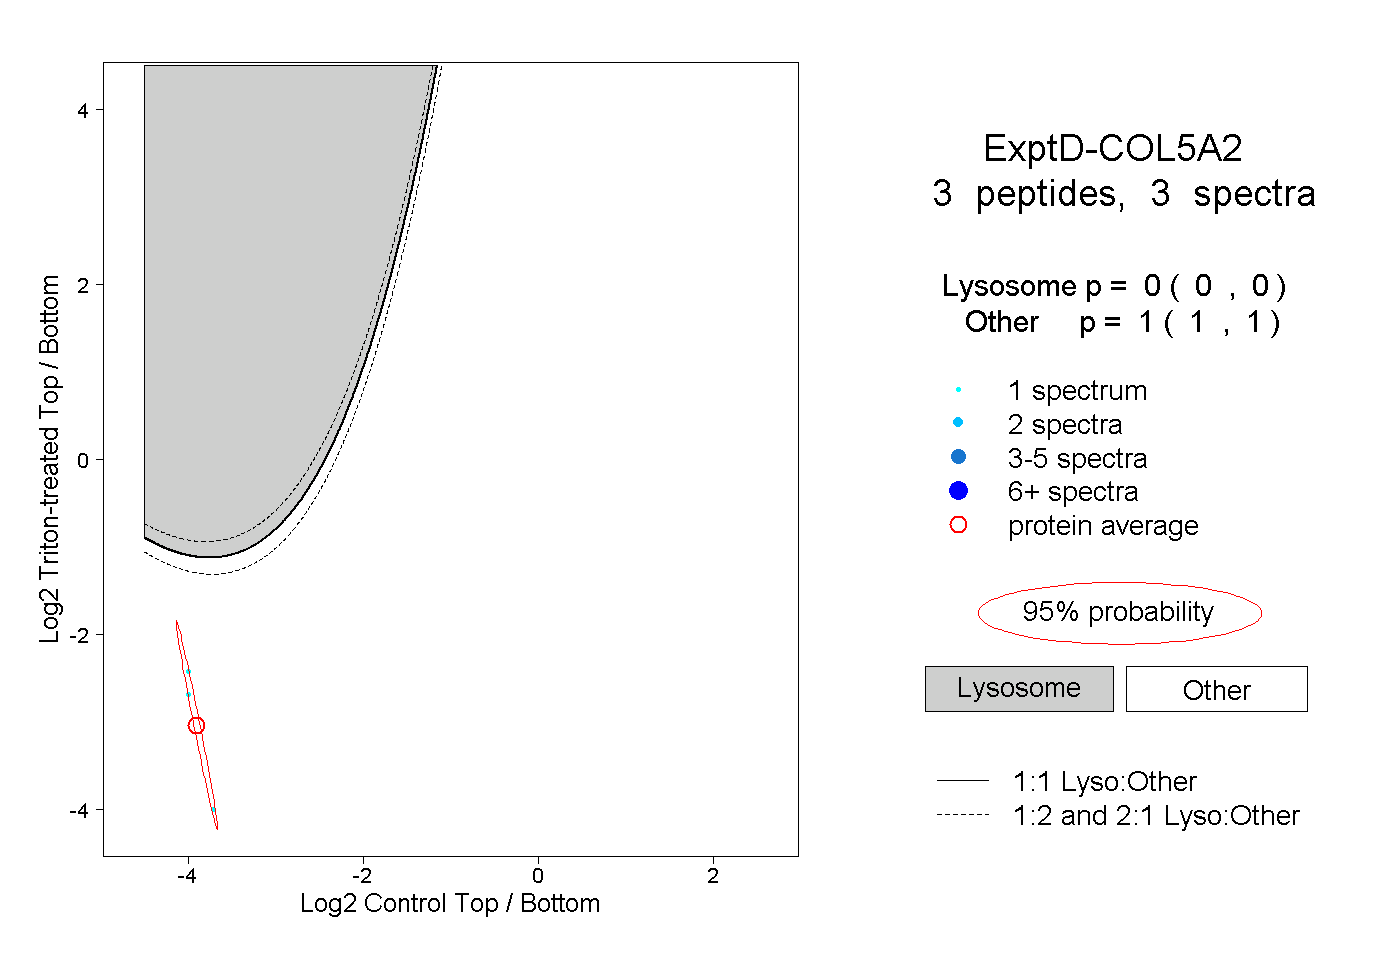 |
0.000 0.000 | 0.000 |
1.000 1.000 | 1.000 |