 63
63peptides
spectra
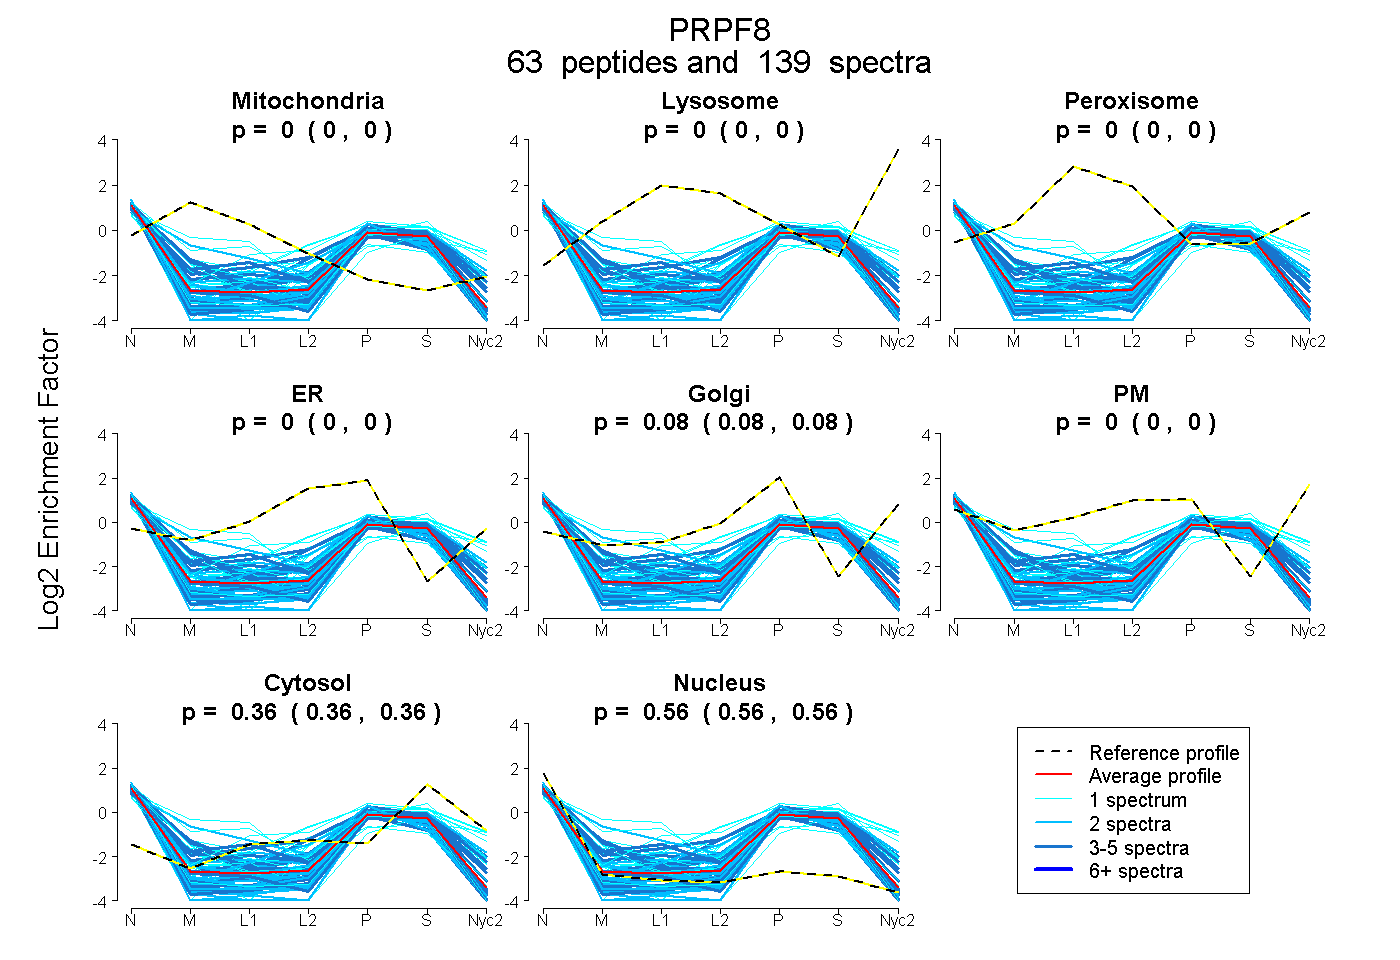
0.000 | 0.000
0.000 | 0.000
0.000 | 0.000
0.000 | 0.000
0.075 | 0.079
0.000 | 0.000
0.359 | 0.361
0.561 | 0.564
15peptides
spectra
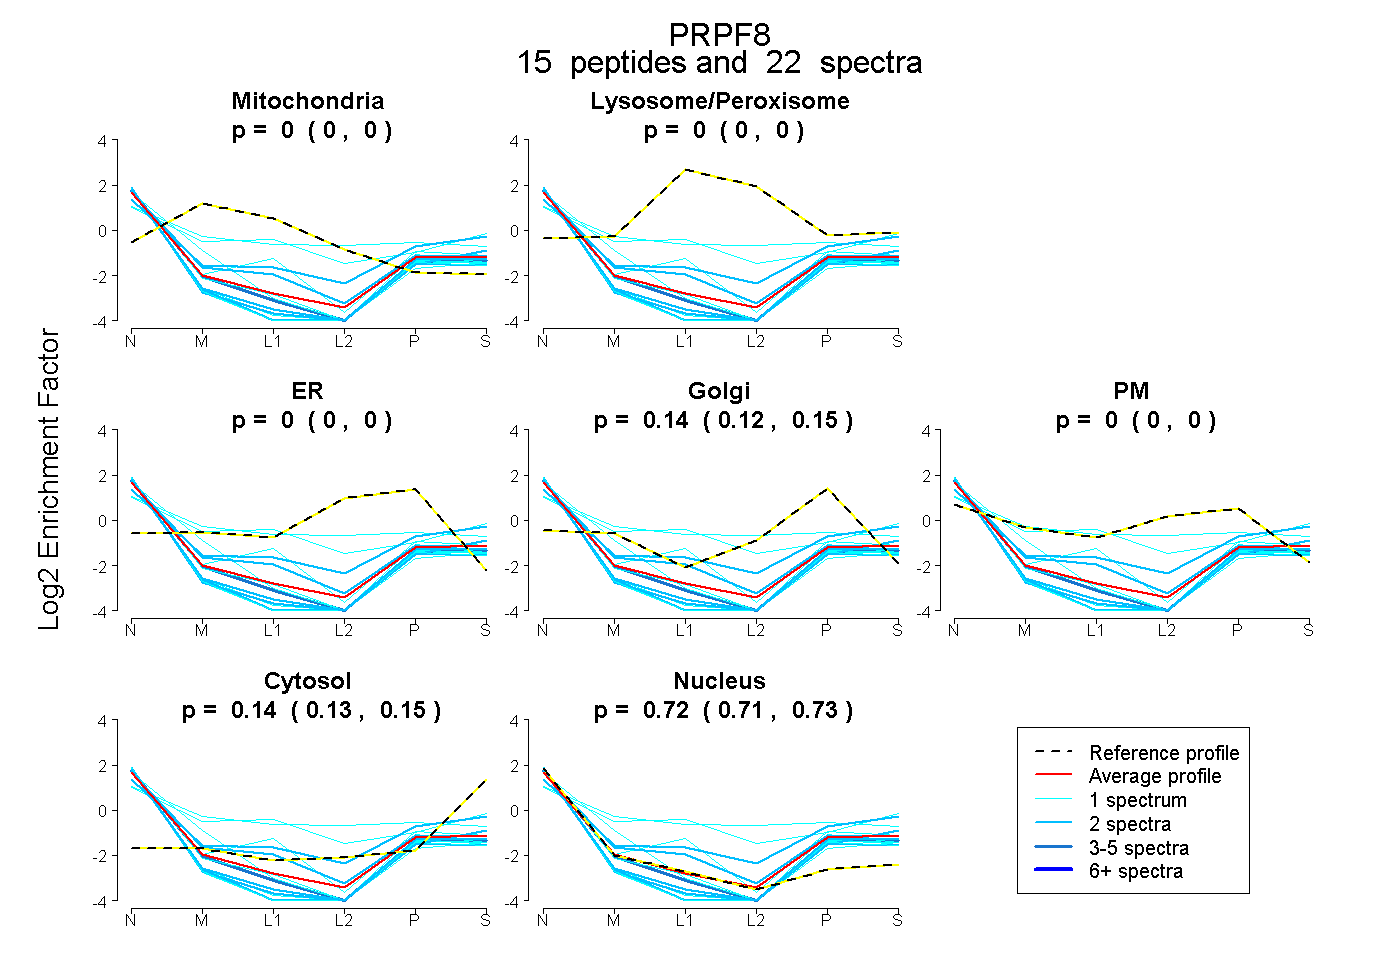
0.000 | 0.000
0.000 | 0.000
0.000 | 0.000
0.124 | 0.150
0.000 | 0.000
0.129 | 0.148
0.709 | 0.733
5peptides
spectra
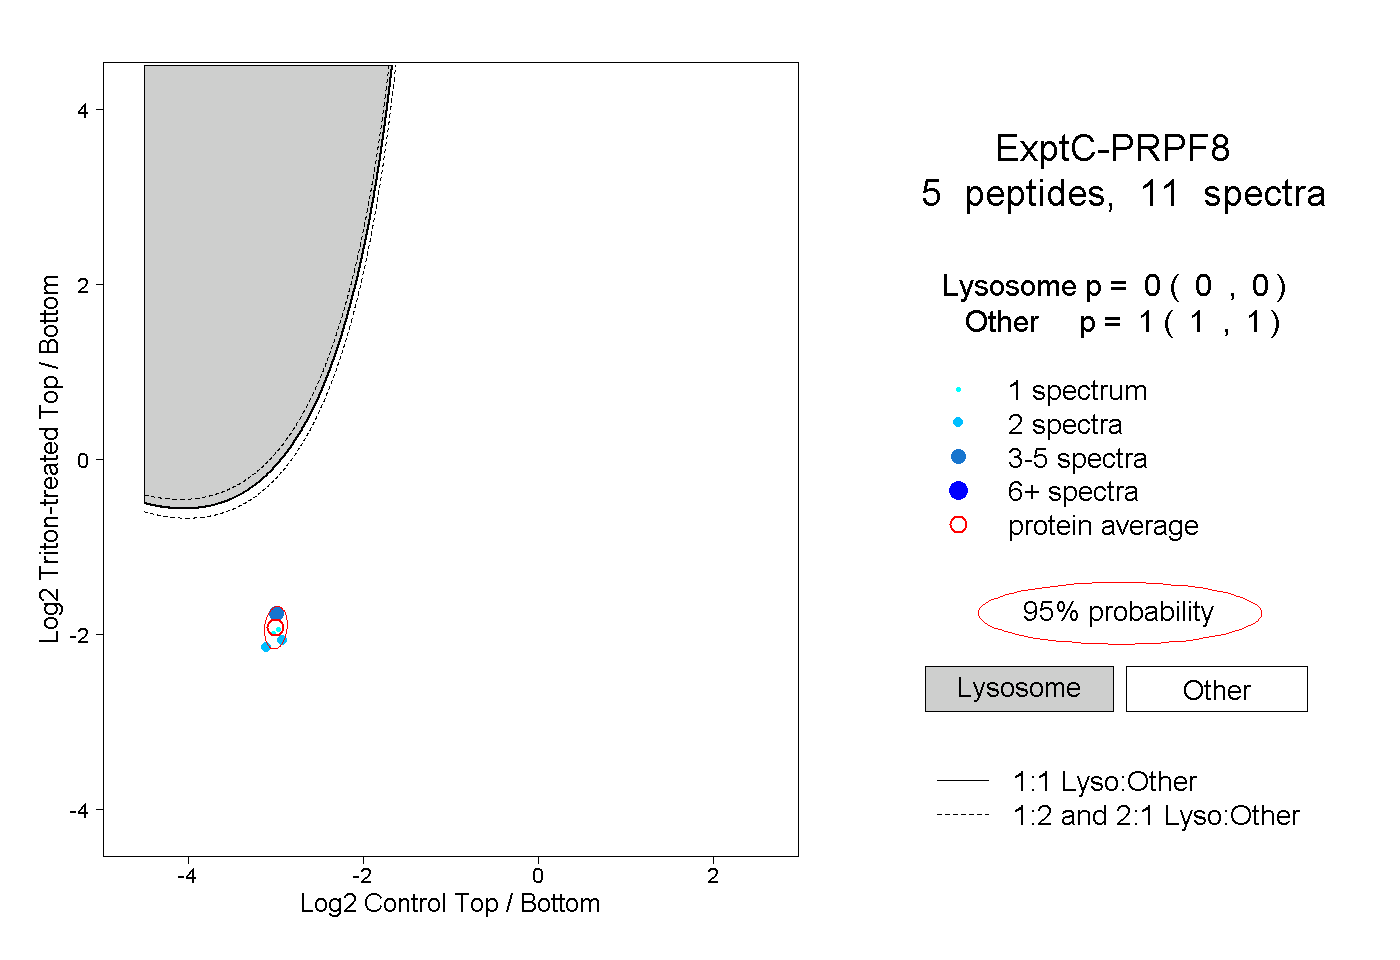
0.000 | 0.000
1.000 | 1.000