 9
9peptides
spectra
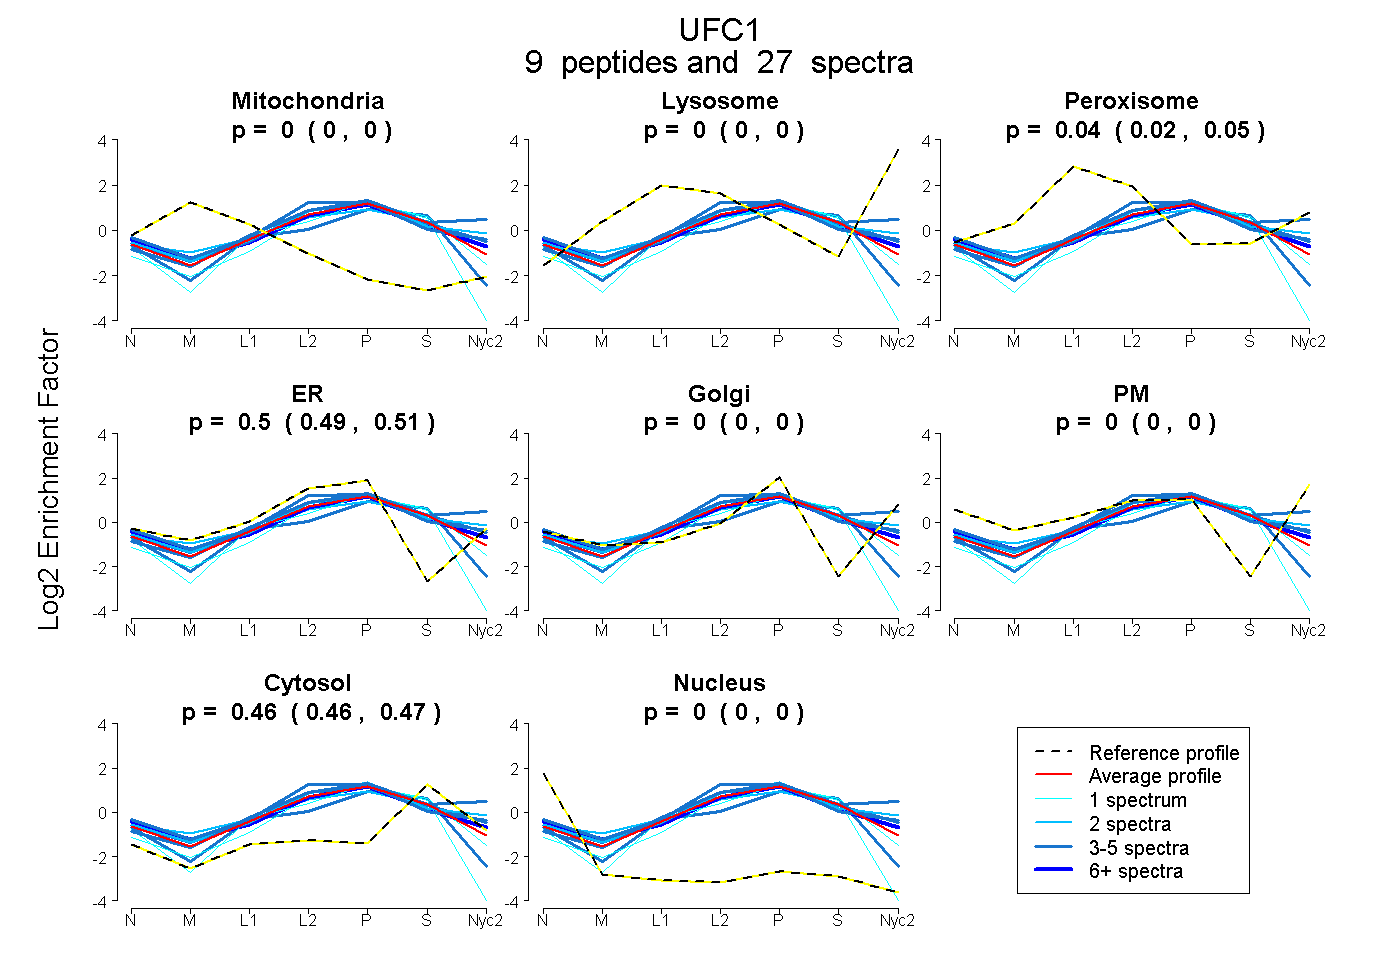
0.000 | 0.000
0.000 | 0.000
0.023 | 0.045
0.493 | 0.507
0.000 | 0.000
0.000 | 0.000
0.457 | 0.471
0.000 | 0.000
3peptides
spectra
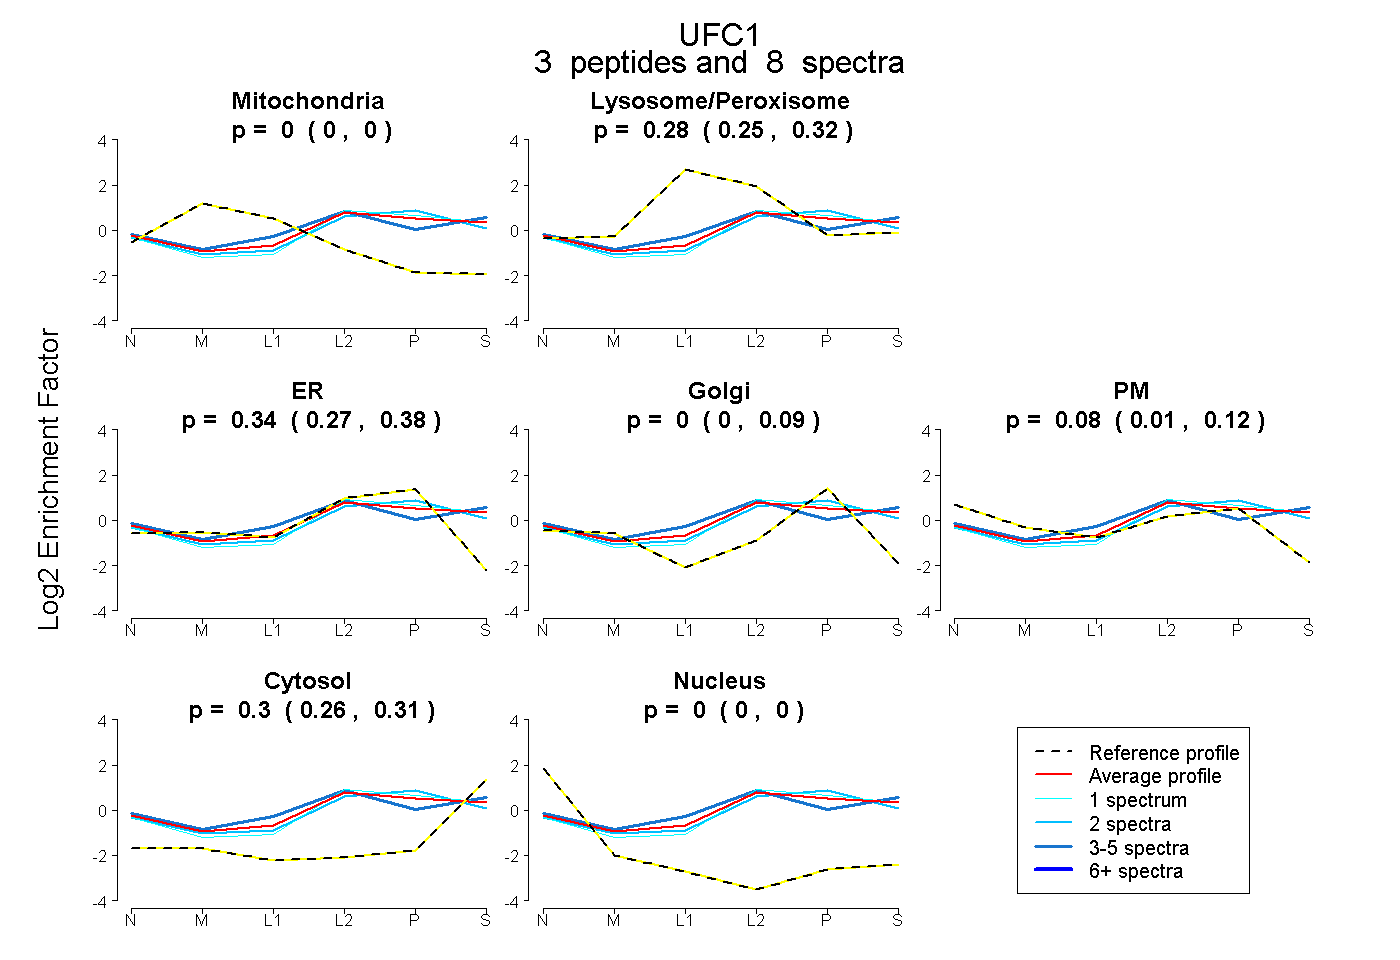
0.000 | 0.000
0.246 | 0.323
0.266 | 0.381
0.000 | 0.085
0.013 | 0.118
0.261 | 0.313
0.000 | 0.000
6peptides
spectra
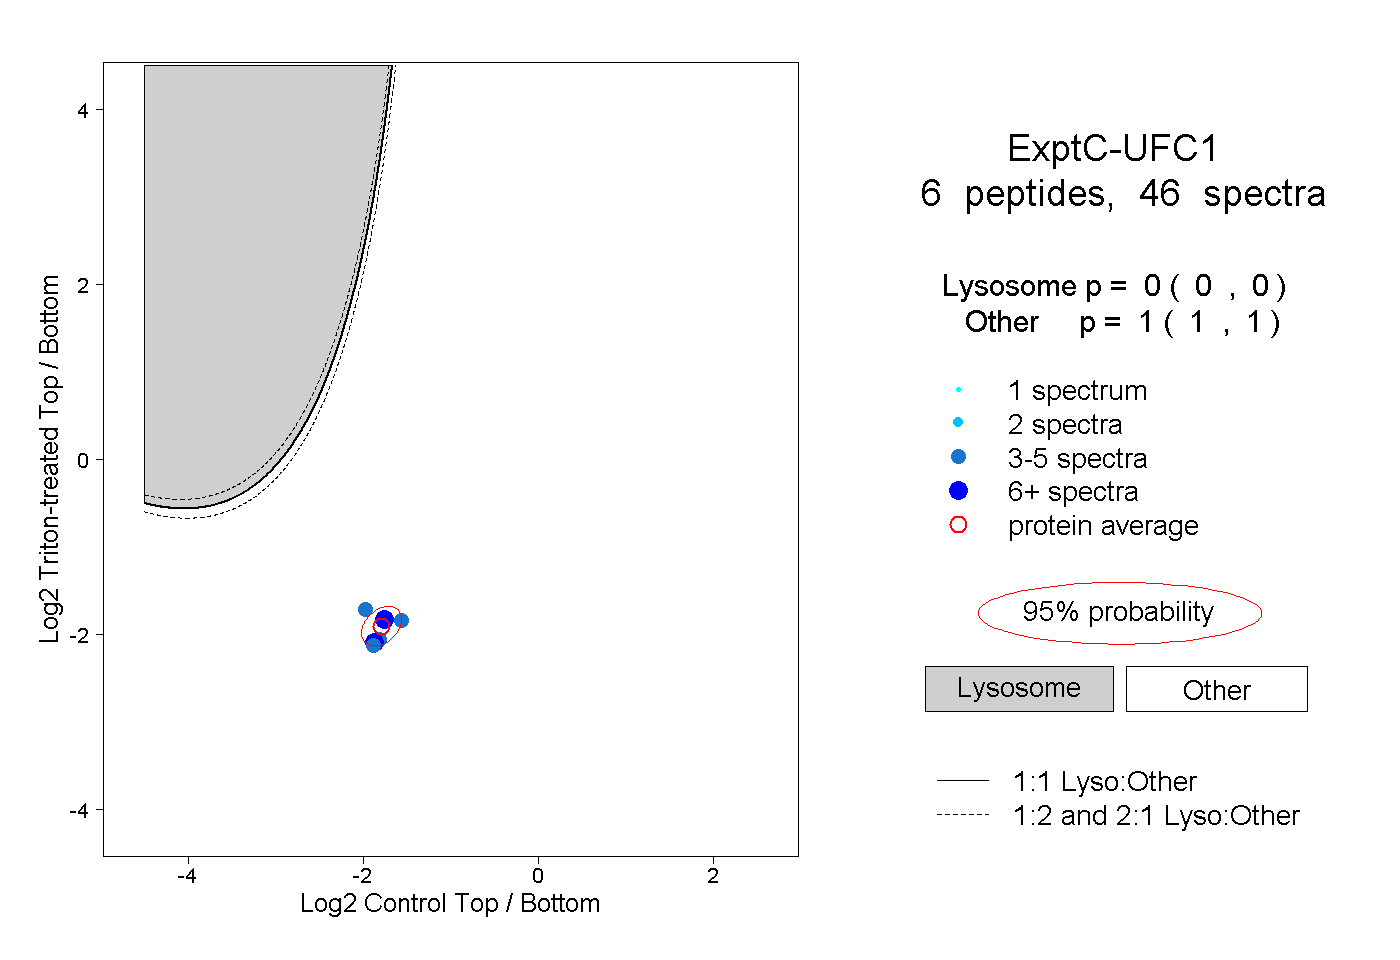
0.000 | 0.000
1.000 | 1.000
3peptides
spectra
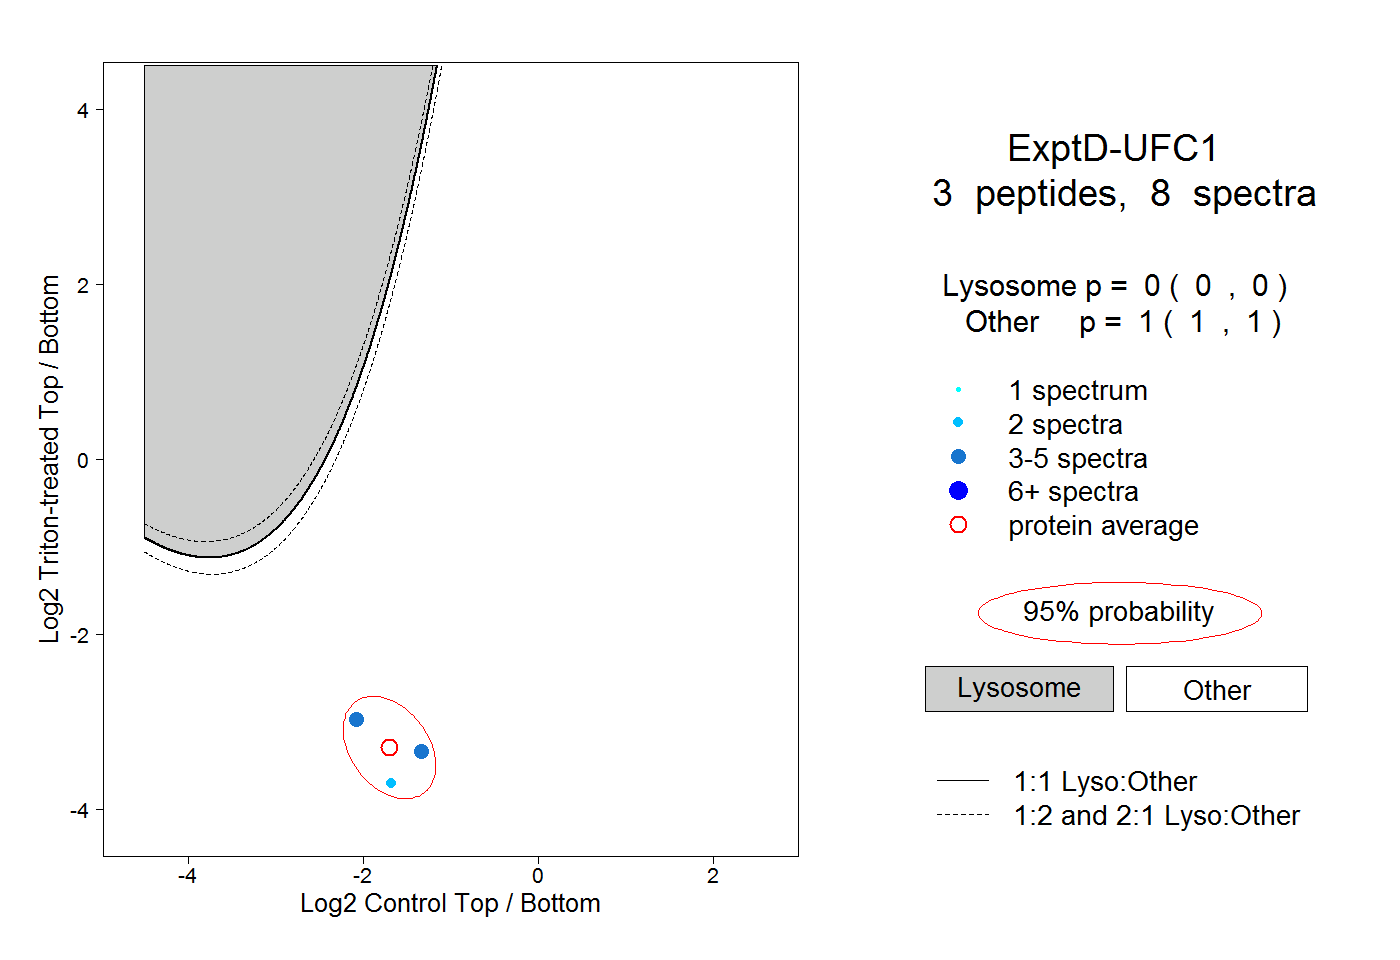
0.000 | 0.000
1.000 | 1.000