 9
9peptides
spectra
0.000 | 0.000
0.000 | 0.000
0.023 | 0.045
0.493 | 0.507
0.000 | 0.000
0.000 | 0.000
0.457 | 0.471
0.000 | 0.000
| Plot | Mito | Lyso | Perox | ER | Golgi | PM | Cytosol | Nucleus | |||||
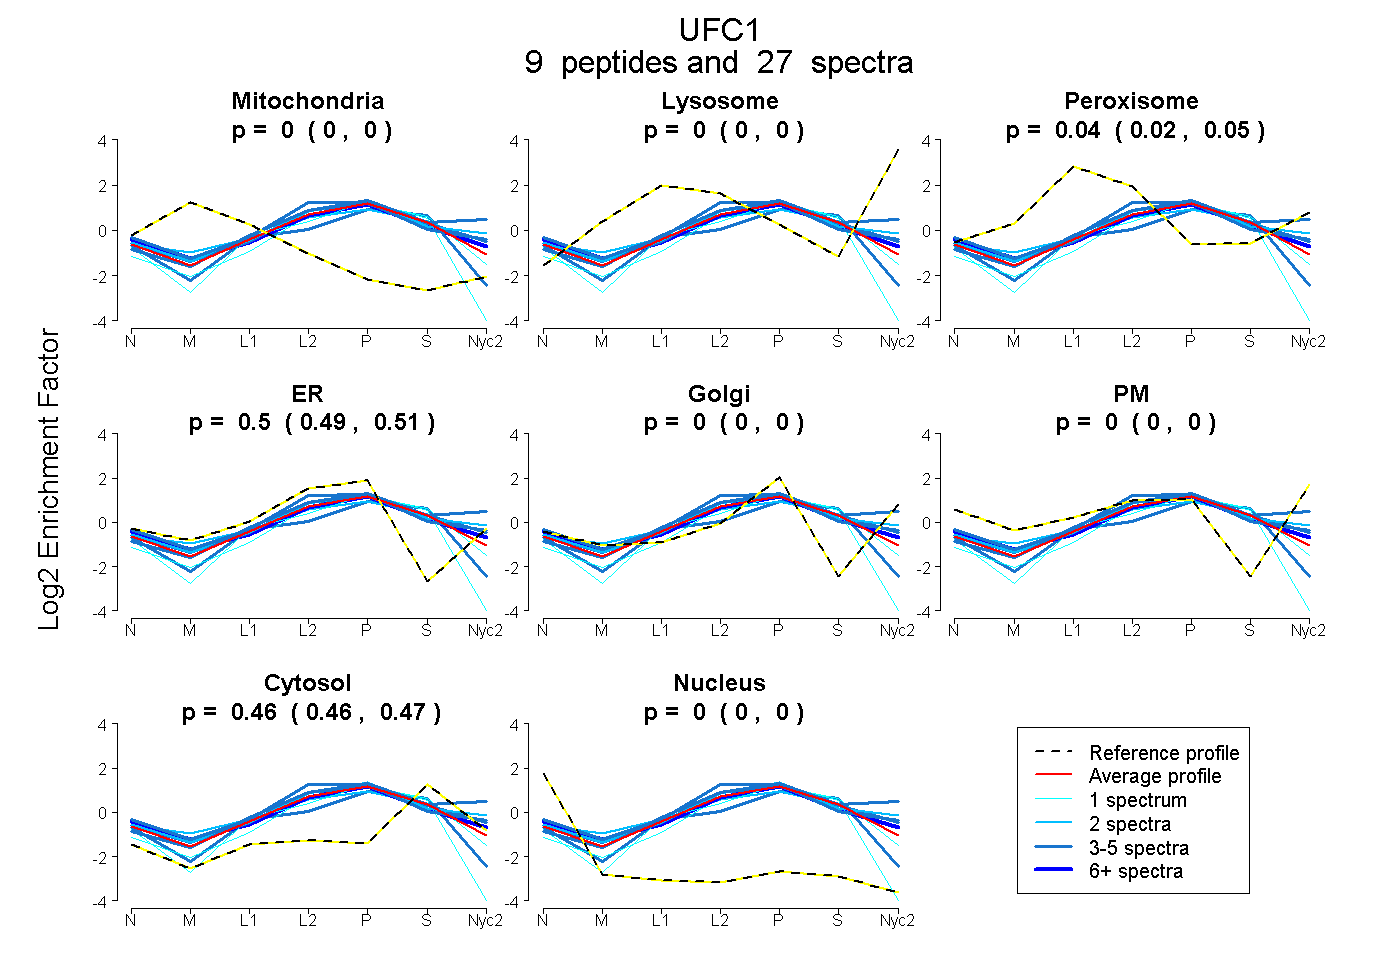
| Expt A |
9 peptides |
27 spectra |
|
0.000 0.000 | 0.000 |
0.000 0.000 | 0.000 |
0.035 0.023 | 0.045 |
0.500 0.493 | 0.507 |
0.000 0.000 | 0.000 |
0.000 0.000 | 0.000 |
0.465 0.457 | 0.471 |
0.000 0.000 | 0.000 |
| 1 spectrum, ELWNLR | 0.000 | 0.000 | 0.000 | 0.439 | 0.000 | 0.000 | 0.561 | 0.000 | ||
| 3 spectra, NADNDWFR | 0.000 | 0.000 | 0.082 | 0.496 | 0.000 | 0.000 | 0.422 | 0.000 | ||
| 4 spectra, CWYIHDFLK | 0.000 | 0.000 | 0.000 | 0.390 | 0.000 | 0.000 | 0.610 | 0.000 | ||
| 2 spectra, TNAGPR | 0.000 | 0.077 | 0.011 | 0.514 | 0.000 | 0.000 | 0.398 | 0.000 | ||
| 2 spectra, ELWVQR | 0.000 | 0.000 | 0.130 | 0.429 | 0.000 | 0.000 | 0.441 | 0.000 | ||
| 1 spectrum, ICLTDHFKPLWAR | 0.000 | 0.000 | 0.000 | 0.396 | 0.000 | 0.000 | 0.531 | 0.073 | ||
| 6 spectra, GVIQHK | 0.000 | 0.000 | 0.047 | 0.525 | 0.000 | 0.000 | 0.428 | 0.000 | ||
| 5 spectra, YVENNK | 0.000 | 0.000 | 0.117 | 0.544 | 0.000 | 0.000 | 0.339 | 0.000 | ||
| 3 spectra, VVSEIPVLK | 0.000 | 0.208 | 0.000 | 0.392 | 0.001 | 0.000 | 0.400 | 0.000 |
| Plot | Mito | Lyso or Perox | ER | Golgi | PM | Cytosol | Nucleus | ||||||
| Expt B |
3 peptides |
8 spectra |
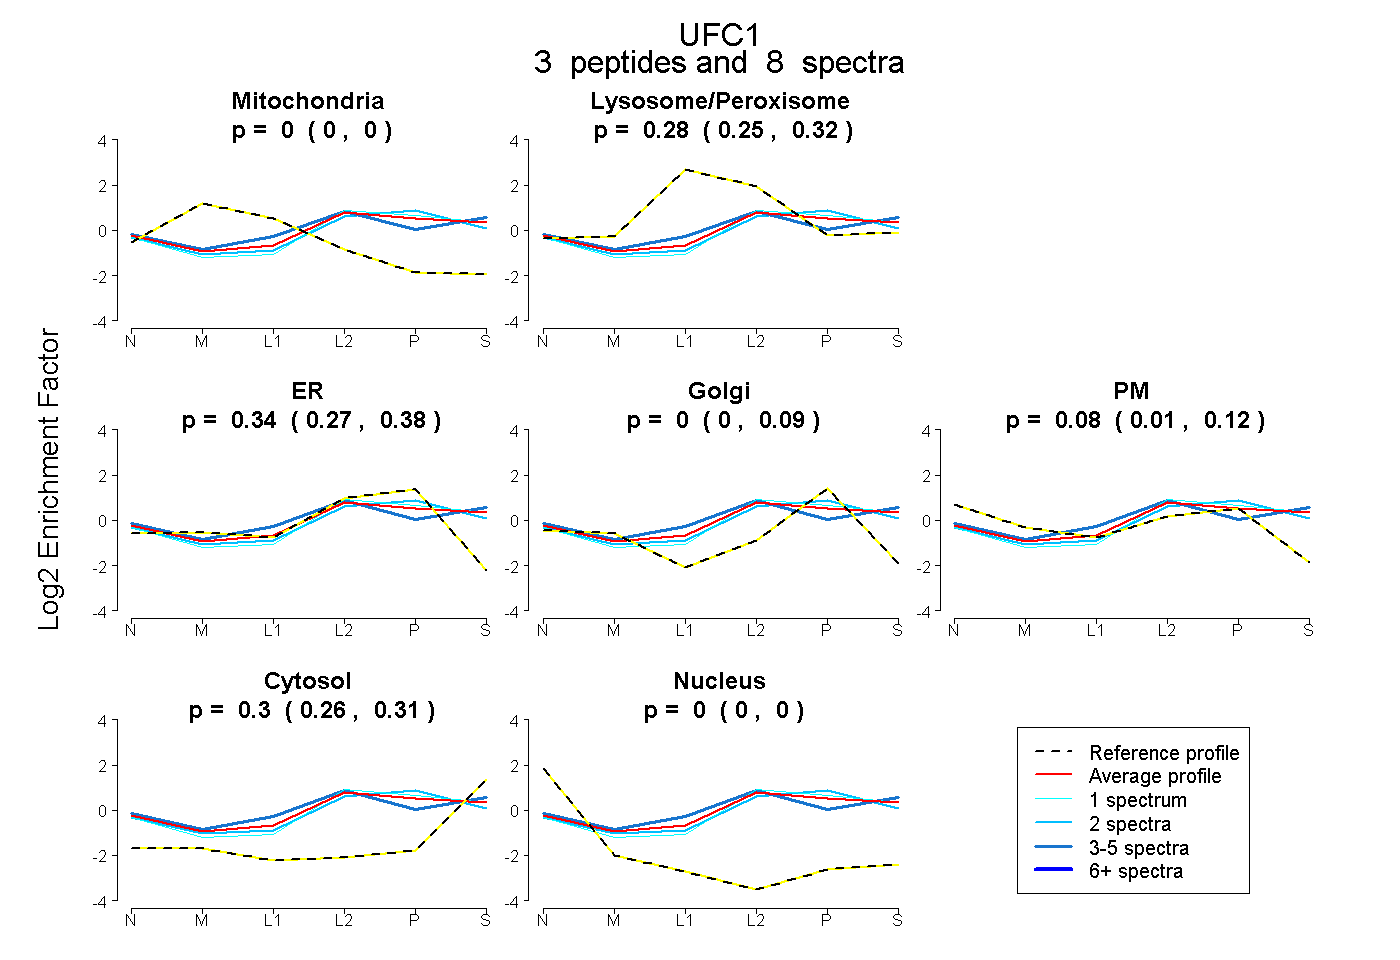 |
0.000 0.000 | 0.000 |
0.280 0.246 | 0.323 |
0.340 0.266 | 0.381 |
0.000 0.000 | 0.085 |
0.084 0.013 | 0.118 |
0.296 0.261 | 0.313 |
0.000 0.000 | 0.000 |
|||
| Plot | Lyso | Other | |||||||||||
| Expt C |
6 peptides |
46 spectra |
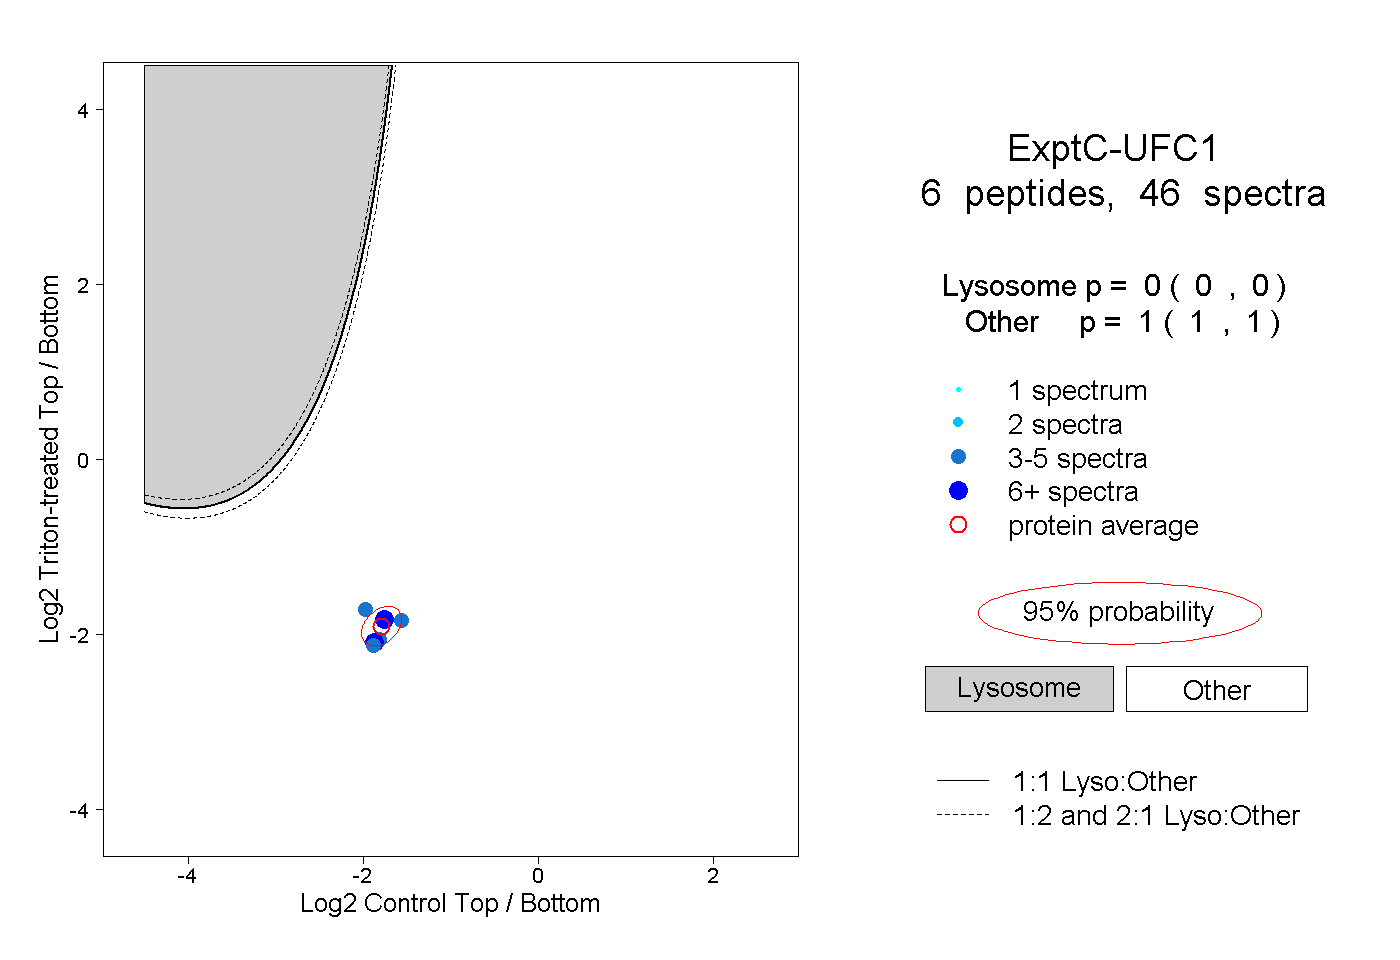 |
0.000 0.000 | 0.000 |
1.000 1.000 | 1.000 |
||||||||
| Plot | Lyso | Other | |||||||||||
| Expt D |
3 peptides |
8 spectra |
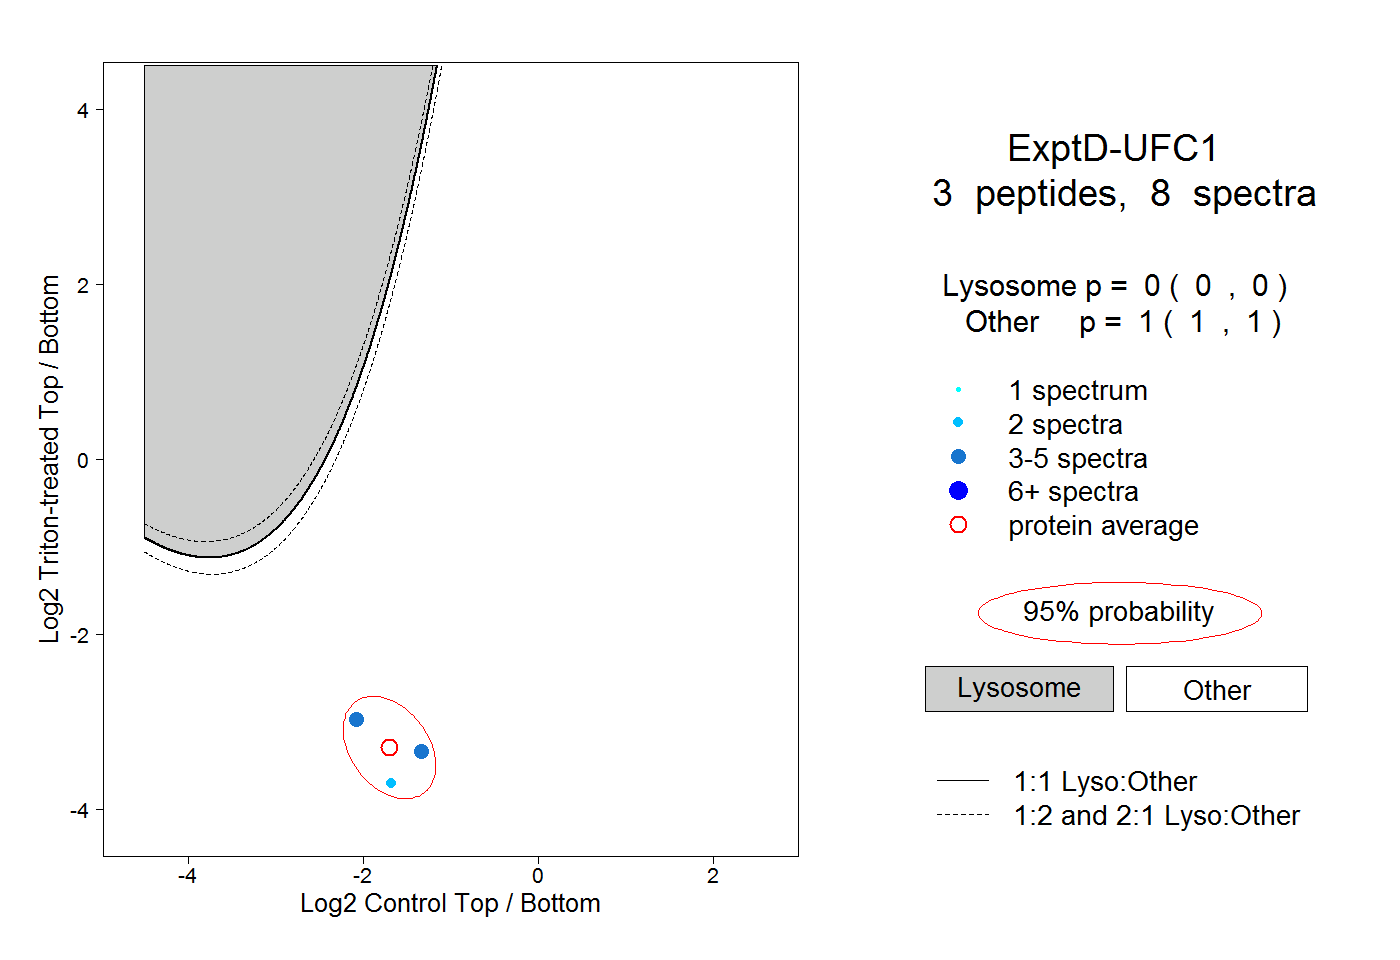 |
0.000 0.000 | 0.000 |
1.000 1.000 | 1.000 |