 9
9peptides
spectra
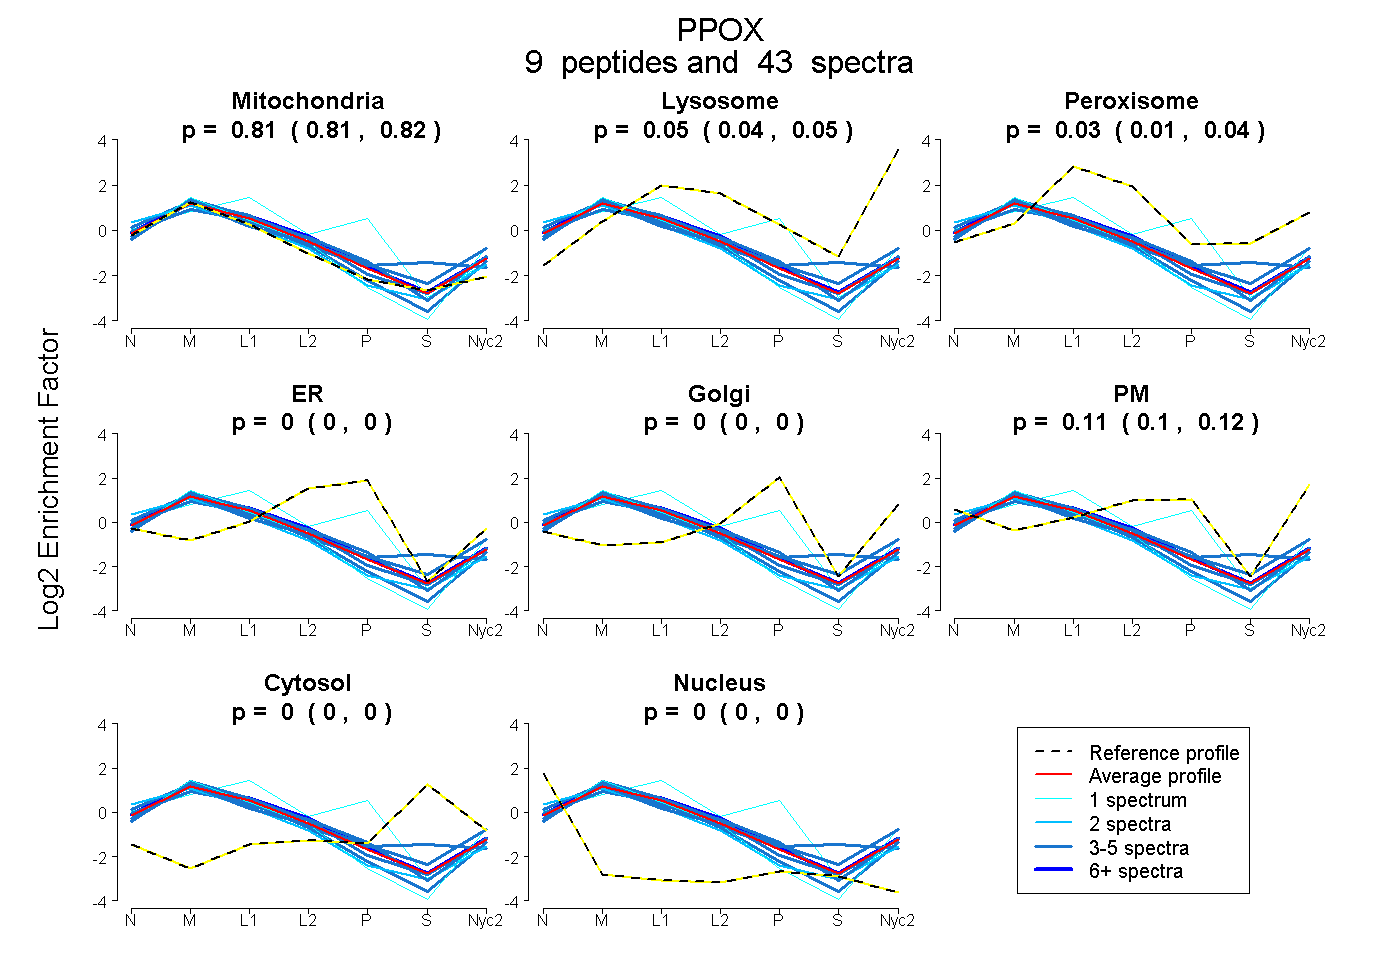
0.806 | 0.820
0.035 | 0.054
0.011 | 0.040
0.000 | 0.000
0.000 | 0.000
0.103 | 0.123
0.000 | 0.000
0.000 | 0.000
7peptides
spectra
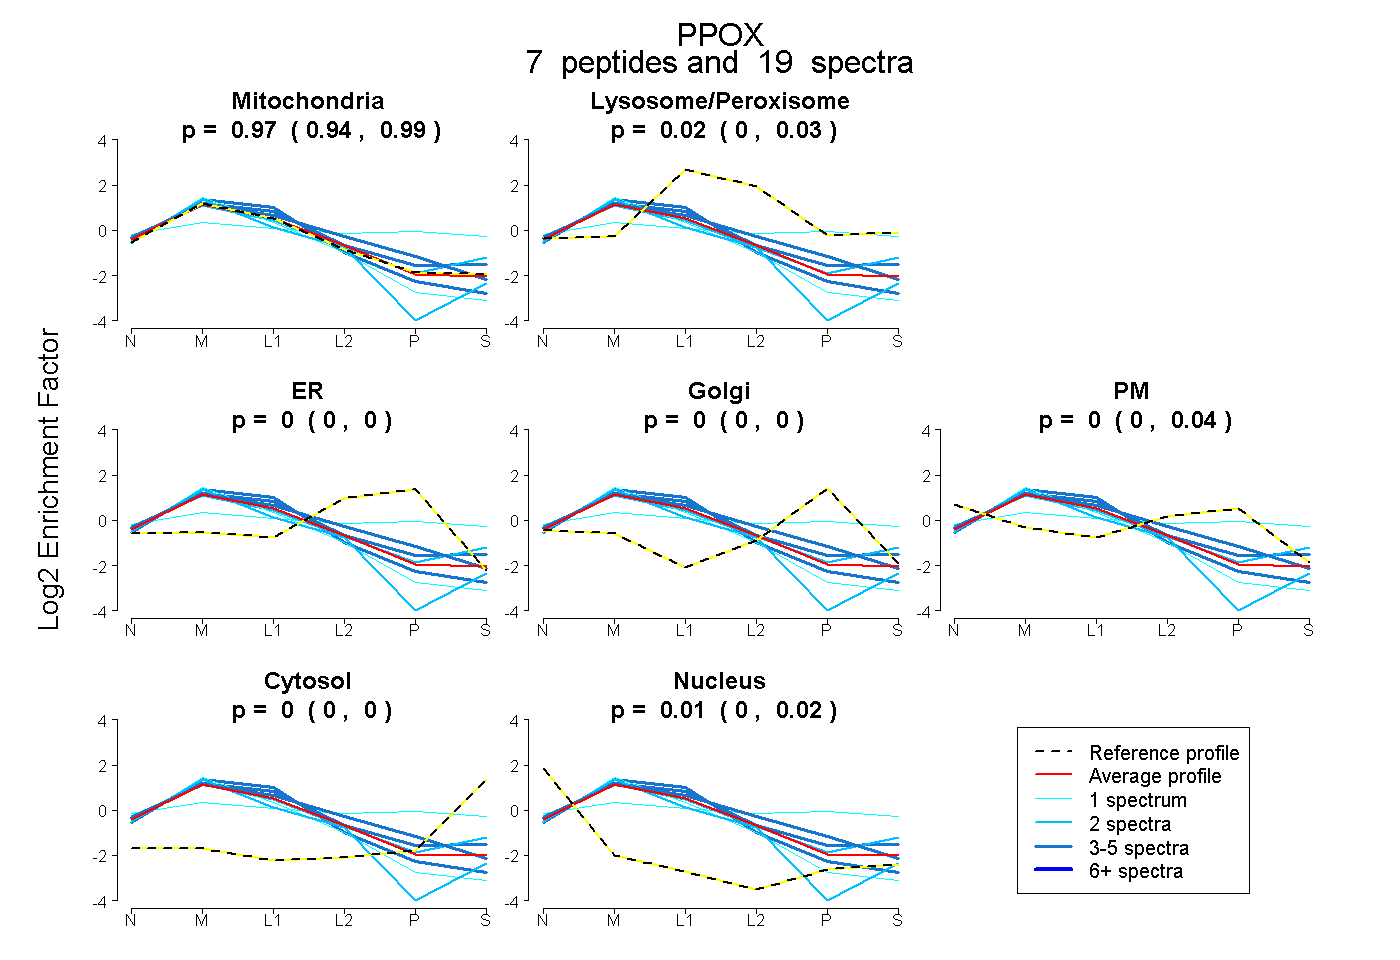
0.935 | 0.993
0.000 | 0.031
0.000 | 0.000
0.000 | 0.000
0.000 | 0.040
0.000 | 0.000
0.000 | 0.016
13peptides
spectra
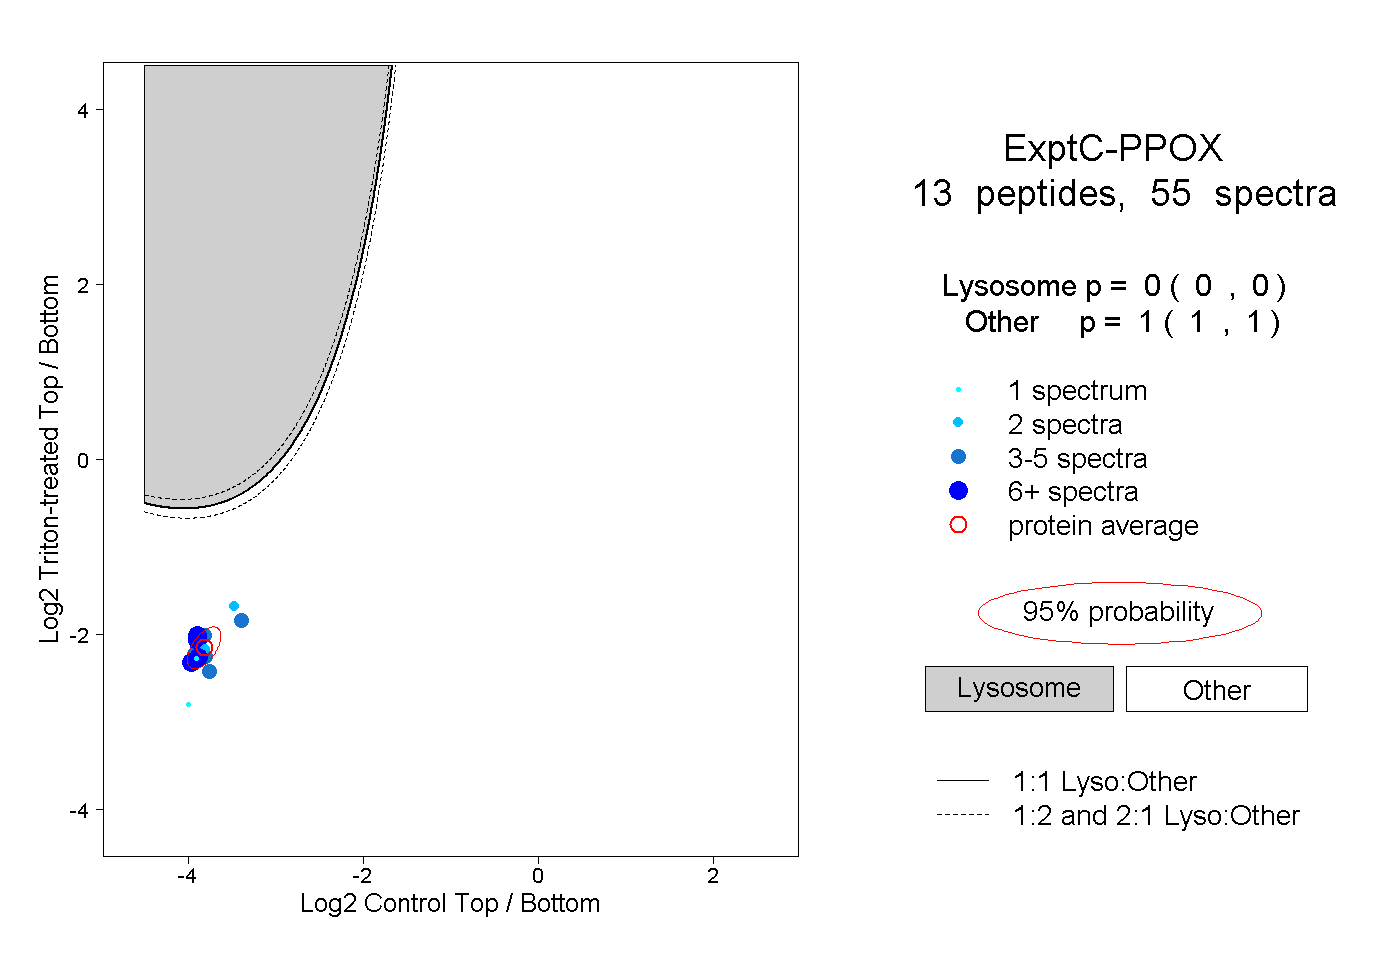
0.000 | 0.000
1.000 | 1.000
5peptides
spectra
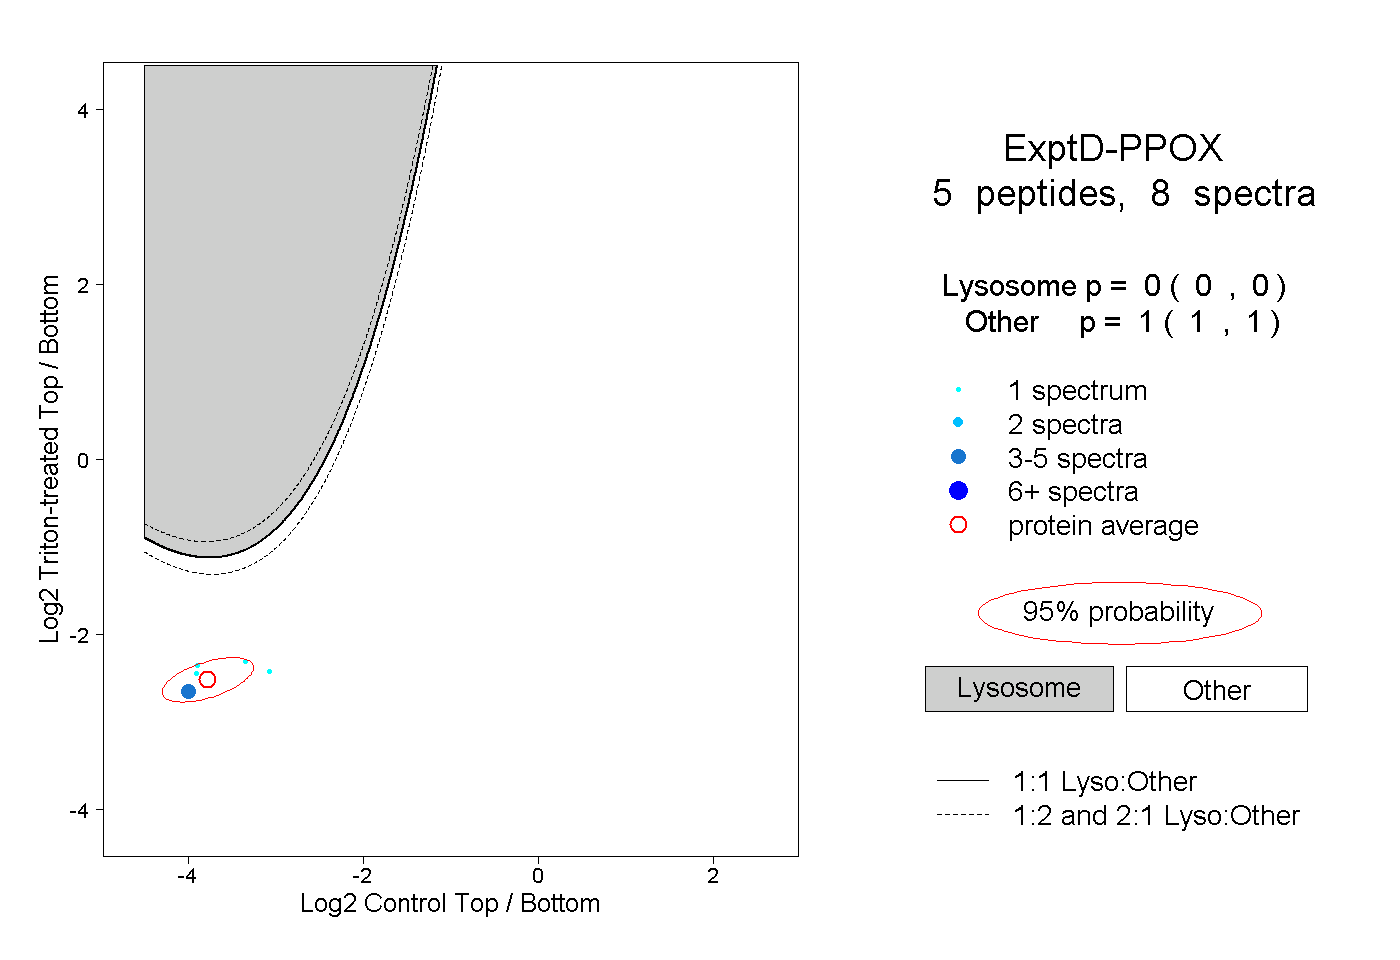
0.000 | 0.000
1.000 | 1.000