 9
9peptides
spectra
0.806 | 0.820
0.035 | 0.054
0.011 | 0.040
0.000 | 0.000
0.000 | 0.000
0.103 | 0.123
0.000 | 0.000
0.000 | 0.000
| Plot | Mito | Lyso | Perox | ER | Golgi | PM | Cytosol | Nucleus | |||||
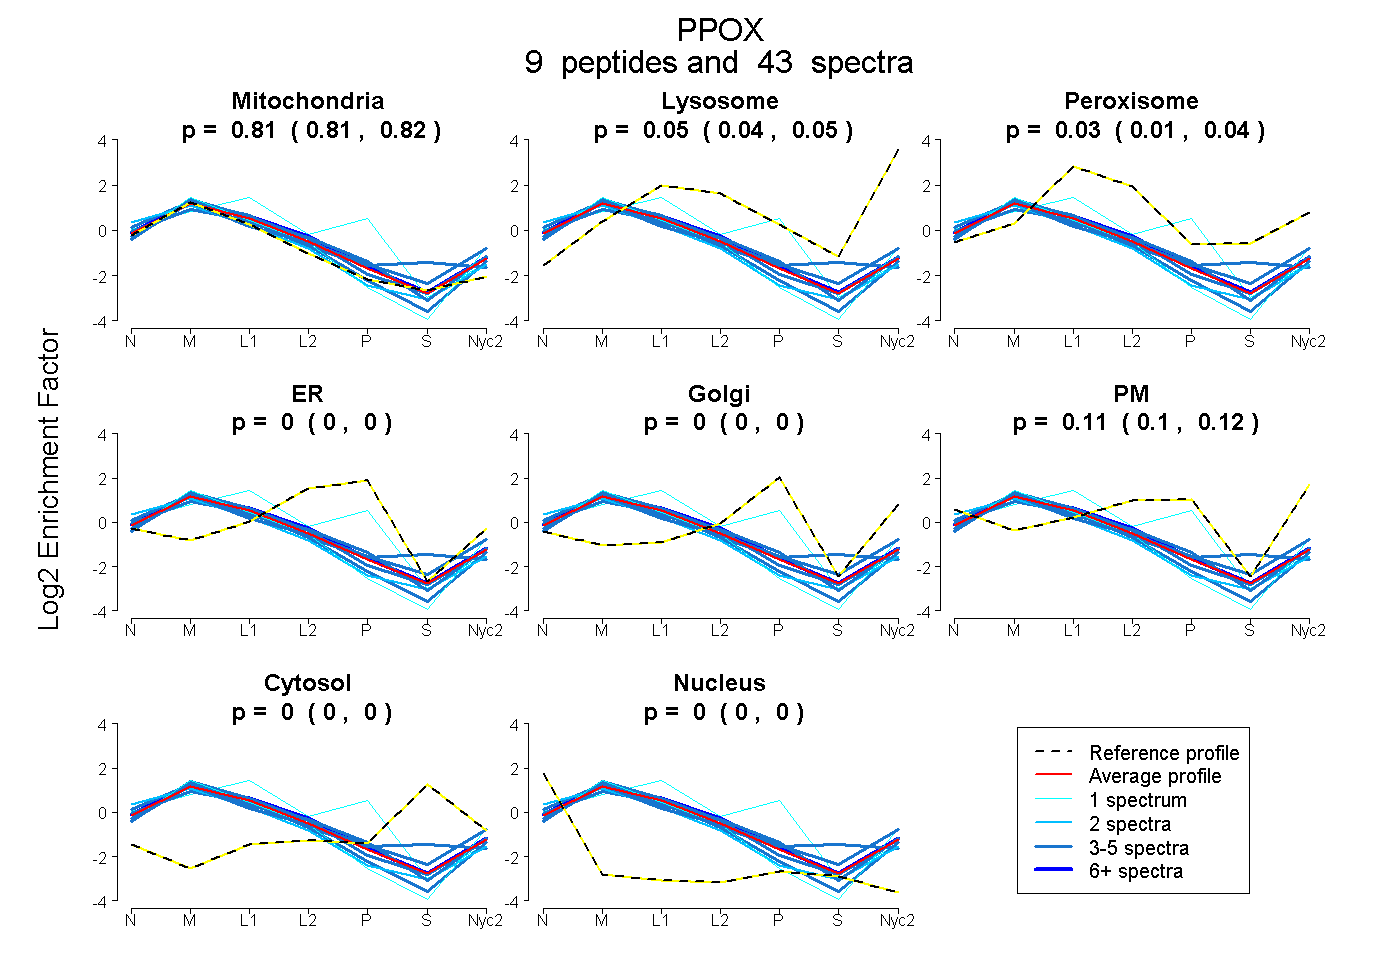
| Expt A |
9 peptides |
43 spectra |
|
0.813 0.806 | 0.820 |
0.045 0.035 | 0.054 |
0.028 0.011 | 0.040 |
0.000 0.000 | 0.000 |
0.000 0.000 | 0.000 |
0.114 0.103 | 0.123 |
0.000 0.000 | 0.000 |
0.000 0.000 | 0.000 |
| 4 spectra, NCIPQYTLGHWQK | 0.857 | 0.139 | 0.003 | 0.000 | 0.000 | 0.000 | 0.000 | 0.000 | ||
| 4 spectra, GVFAGNSQELSIR | 0.902 | 0.000 | 0.000 | 0.000 | 0.000 | 0.098 | 0.000 | 0.000 | ||
| 4 spectra, WSQWSLR | 0.765 | 0.145 | 0.000 | 0.000 | 0.039 | 0.051 | 0.000 | 0.000 | ||
| 1 spectrum, TLLLVSELGLESEVLPVR | 0.884 | 0.116 | 0.000 | 0.000 | 0.000 | 0.000 | 0.000 | 0.000 | ||
| 2 spectra, LDSALQFLTAQR | 0.893 | 0.000 | 0.000 | 0.000 | 0.000 | 0.075 | 0.000 | 0.032 | ||
| 4 spectra, GSDGAIFELGPR | 0.718 | 0.000 | 0.155 | 0.000 | 0.000 | 0.000 | 0.126 | 0.000 | ||
| 20 spectra, GIRPAGALGAR | 0.771 | 0.018 | 0.085 | 0.000 | 0.000 | 0.125 | 0.000 | 0.000 | ||
| 3 spectra, LGGWIR | 0.769 | 0.034 | 0.000 | 0.070 | 0.000 | 0.128 | 0.000 | 0.000 | ||
| 1 spectrum, EQPSHCLVHLHK | 0.490 | 0.000 | 0.070 | 0.440 | 0.000 | 0.000 | 0.000 | 0.000 |
| Plot | Mito | Lyso or Perox | ER | Golgi | PM | Cytosol | Nucleus | ||||||
| Expt B |
7 peptides |
19 spectra |
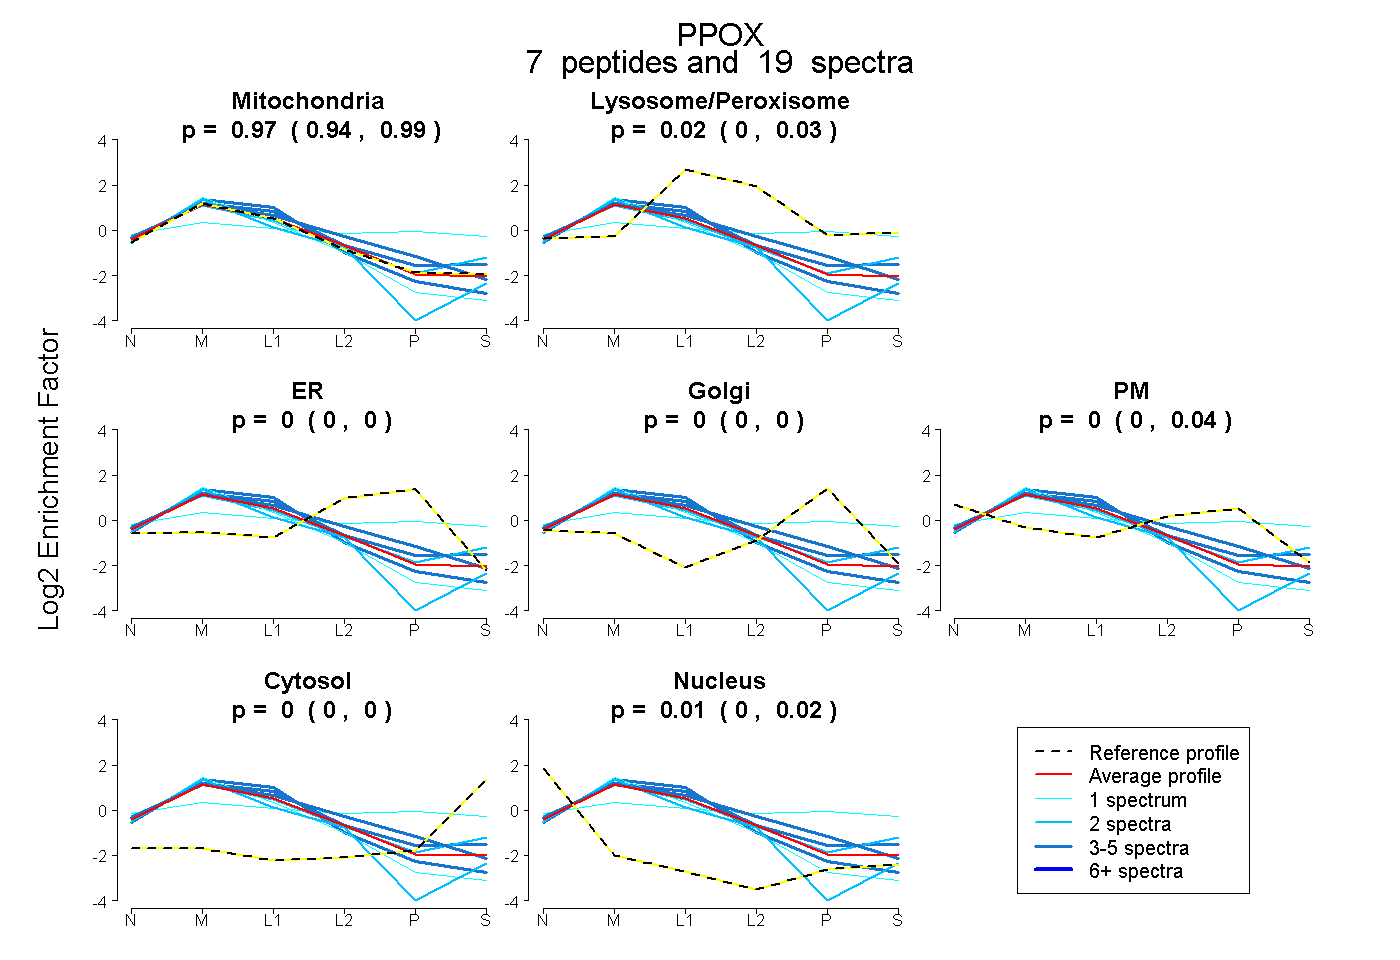 |
0.973 0.935 | 0.993 |
0.017 0.000 | 0.031 |
0.000 0.000 | 0.000 |
0.000 0.000 | 0.000 |
0.003 0.000 | 0.040 |
0.000 0.000 | 0.000 |
0.008 0.000 | 0.016 |
|||
| Plot | Lyso | Other | |||||||||||
| Expt C |
13 peptides |
55 spectra |
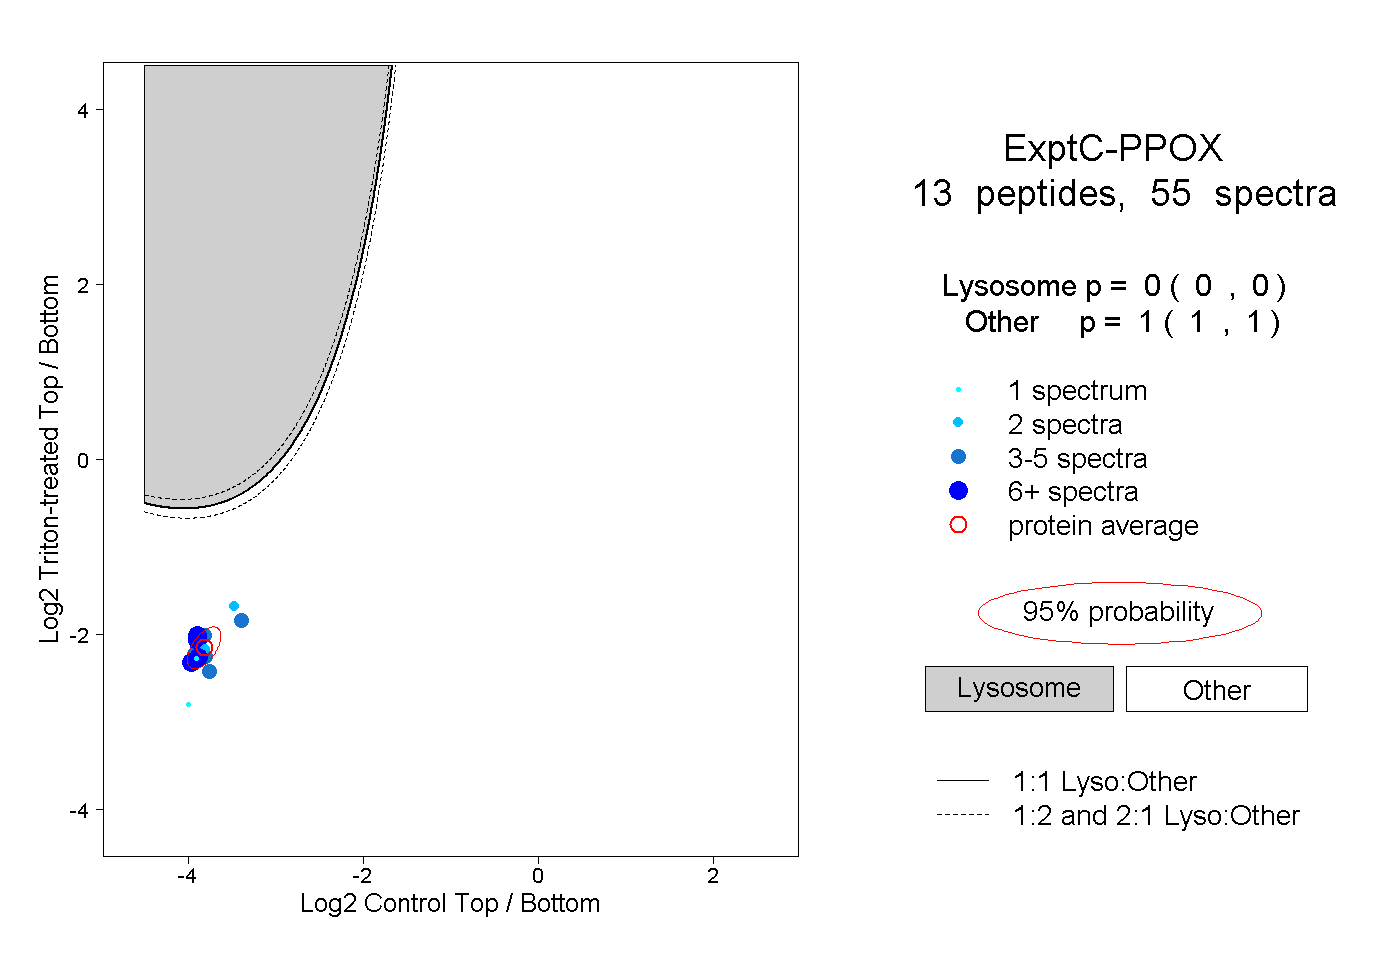 |
0.000 0.000 | 0.000 |
1.000 1.000 | 1.000 |
||||||||
| Plot | Lyso | Other | |||||||||||
| Expt D |
5 peptides |
8 spectra |
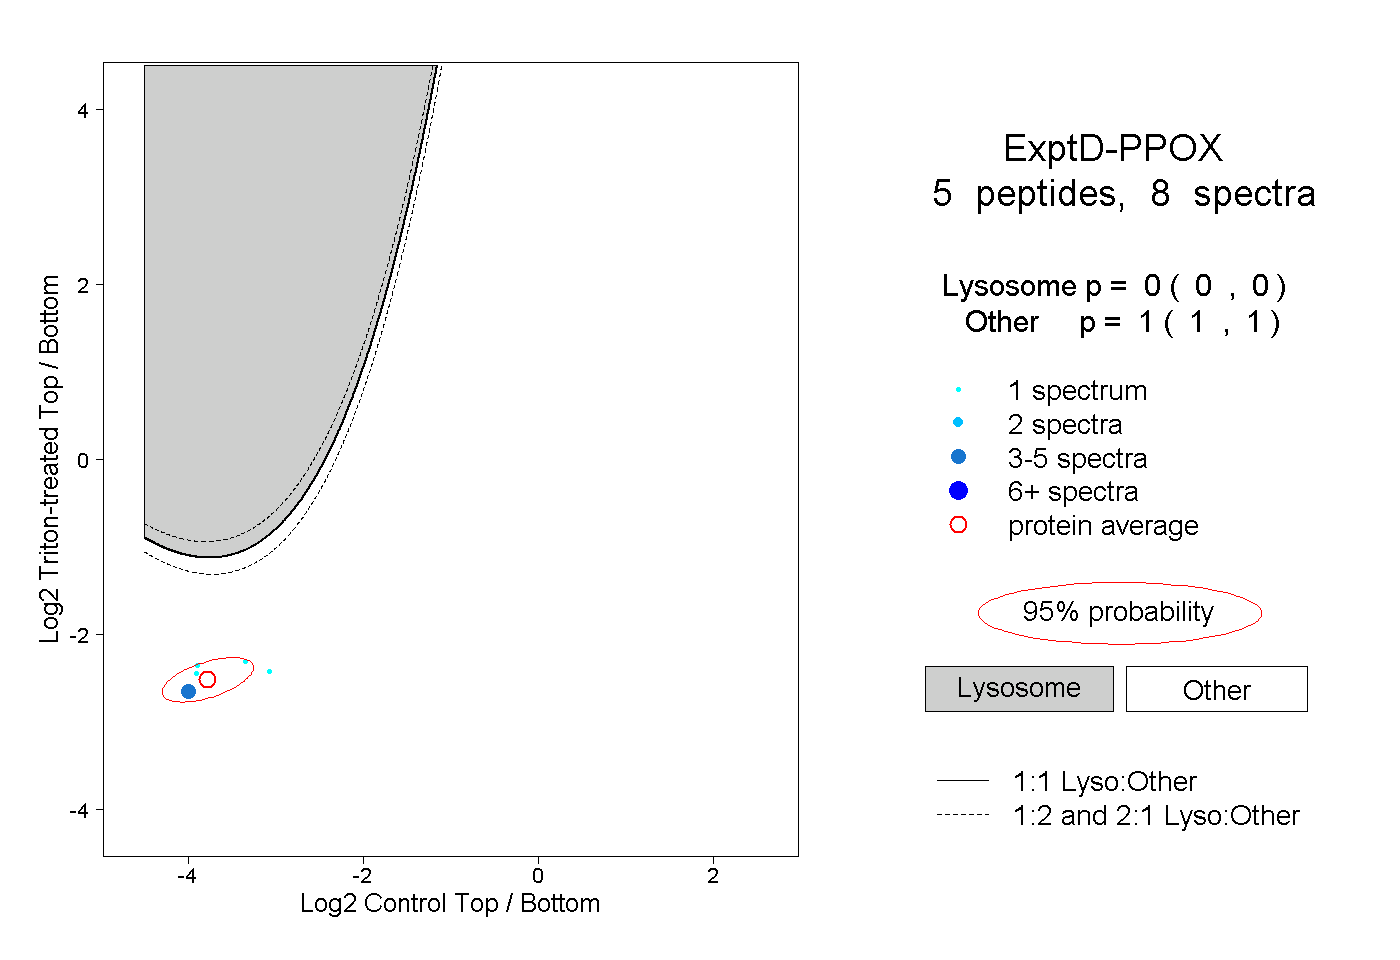 |
0.000 0.000 | 0.000 |
1.000 1.000 | 1.000 |