 8
8peptides
spectra
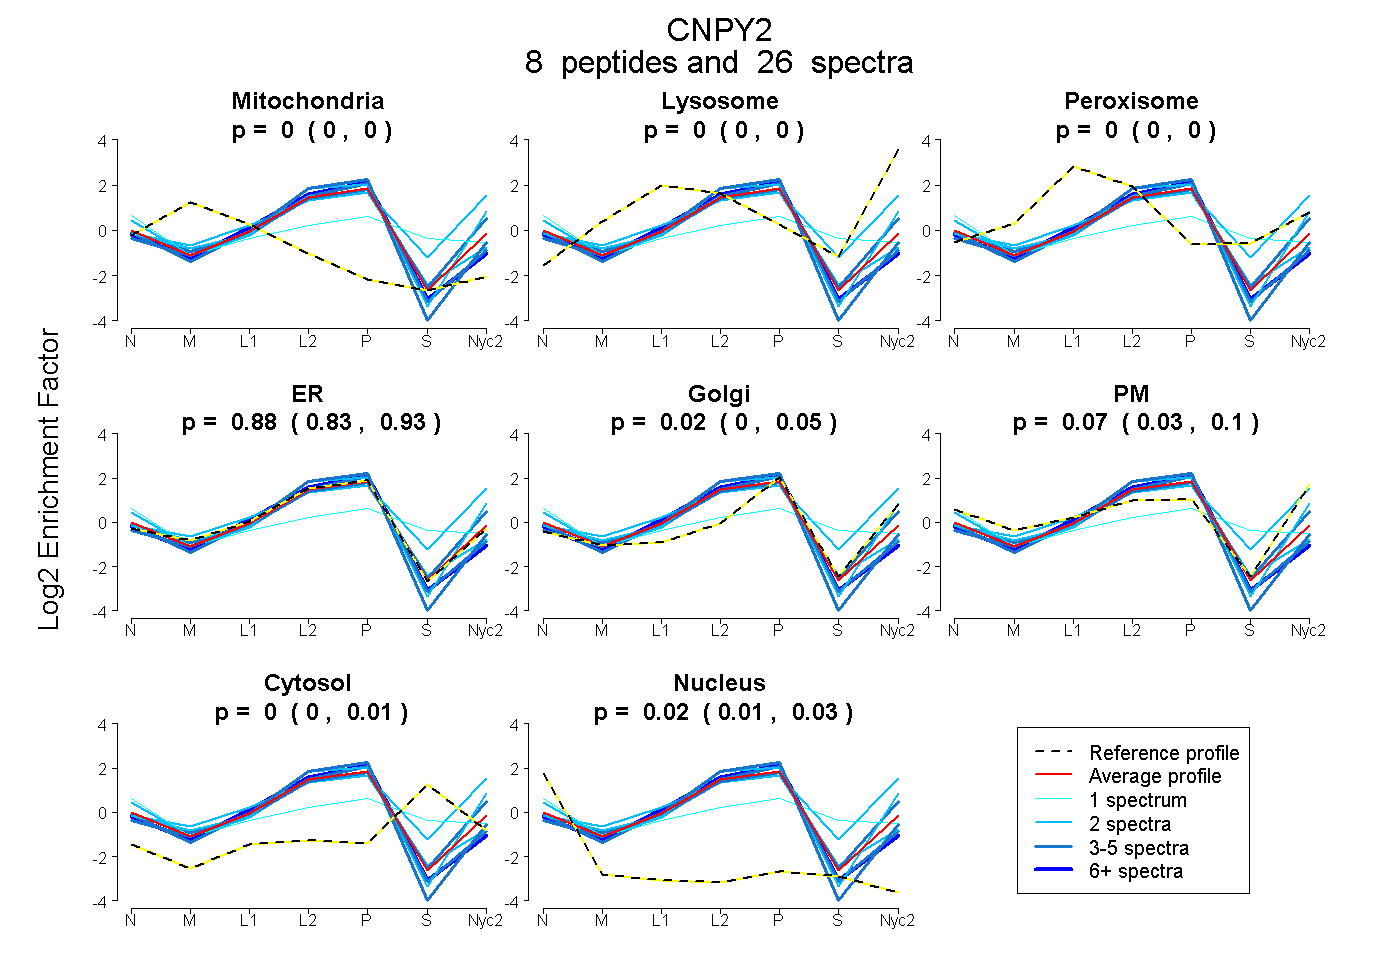
0.000 | 0.000
0.000 | 0.000
0.000 | 0.000
0.833 | 0.926
0.000 | 0.053
0.029 | 0.102
0.000 | 0.009
0.009 | 0.029
6peptides
spectra
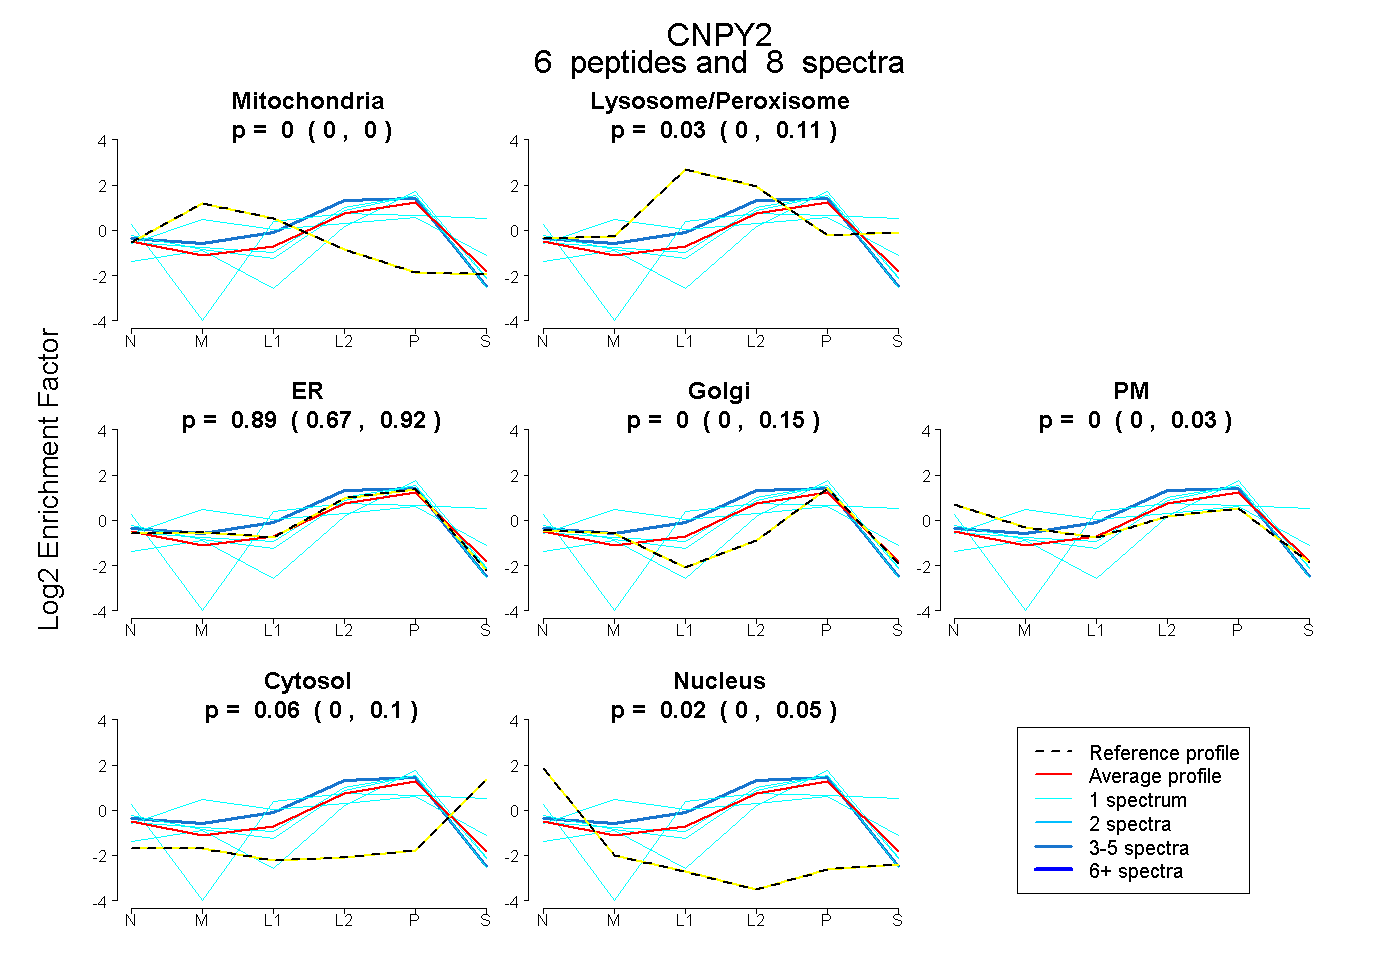
0.000 | 0.000
0.000 | 0.113
0.672 | 0.925
0.000 | 0.154
0.000 | 0.033
0.000 | 0.099
0.000 | 0.050
8peptides
spectra
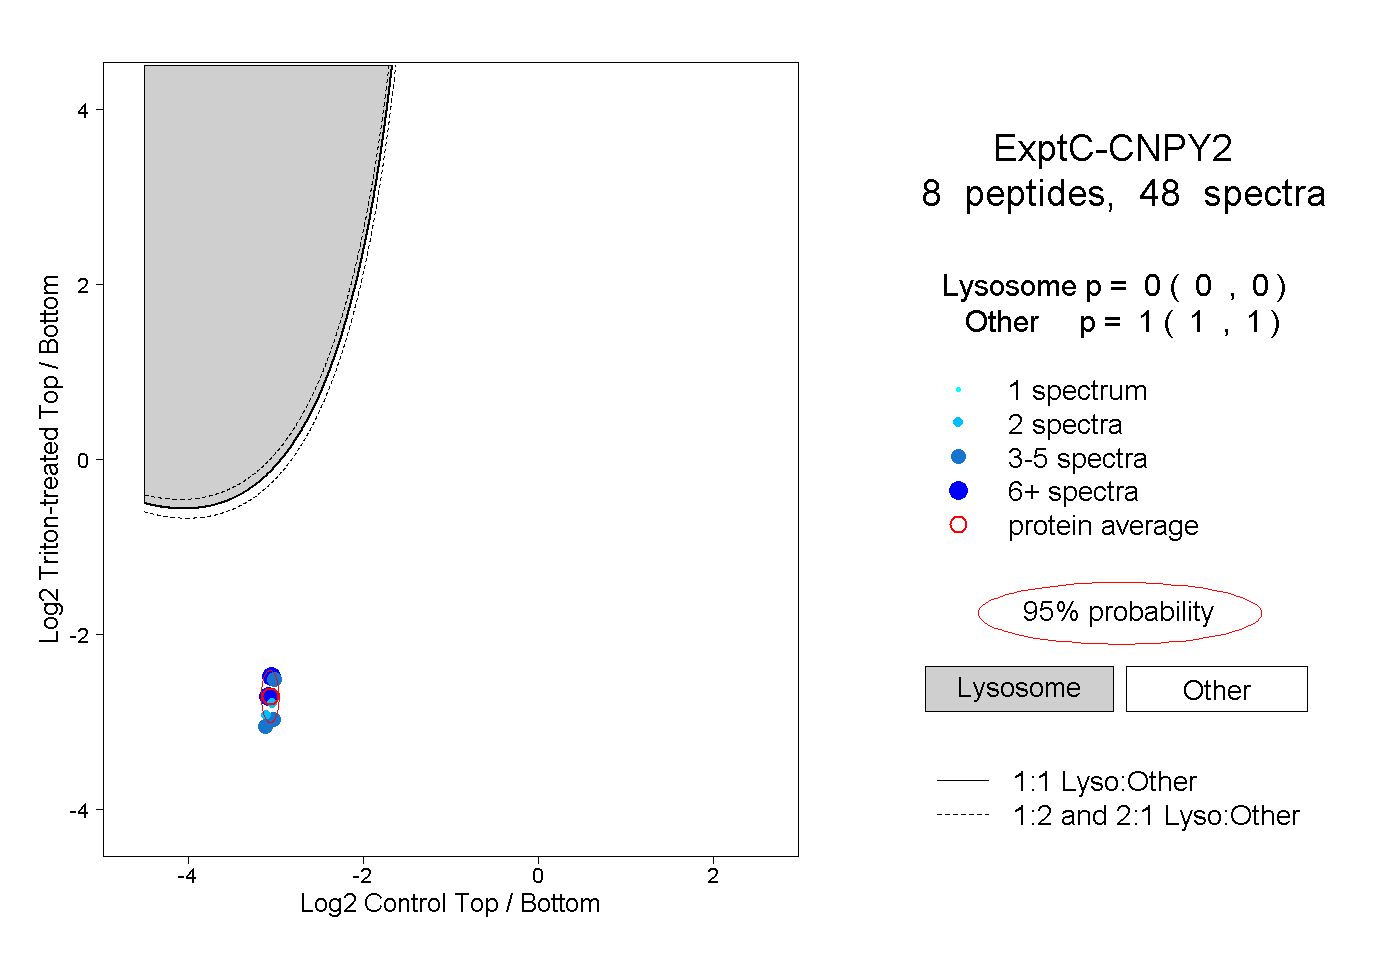
0.000 | 0.000
1.000 | 1.000
5peptides
spectra
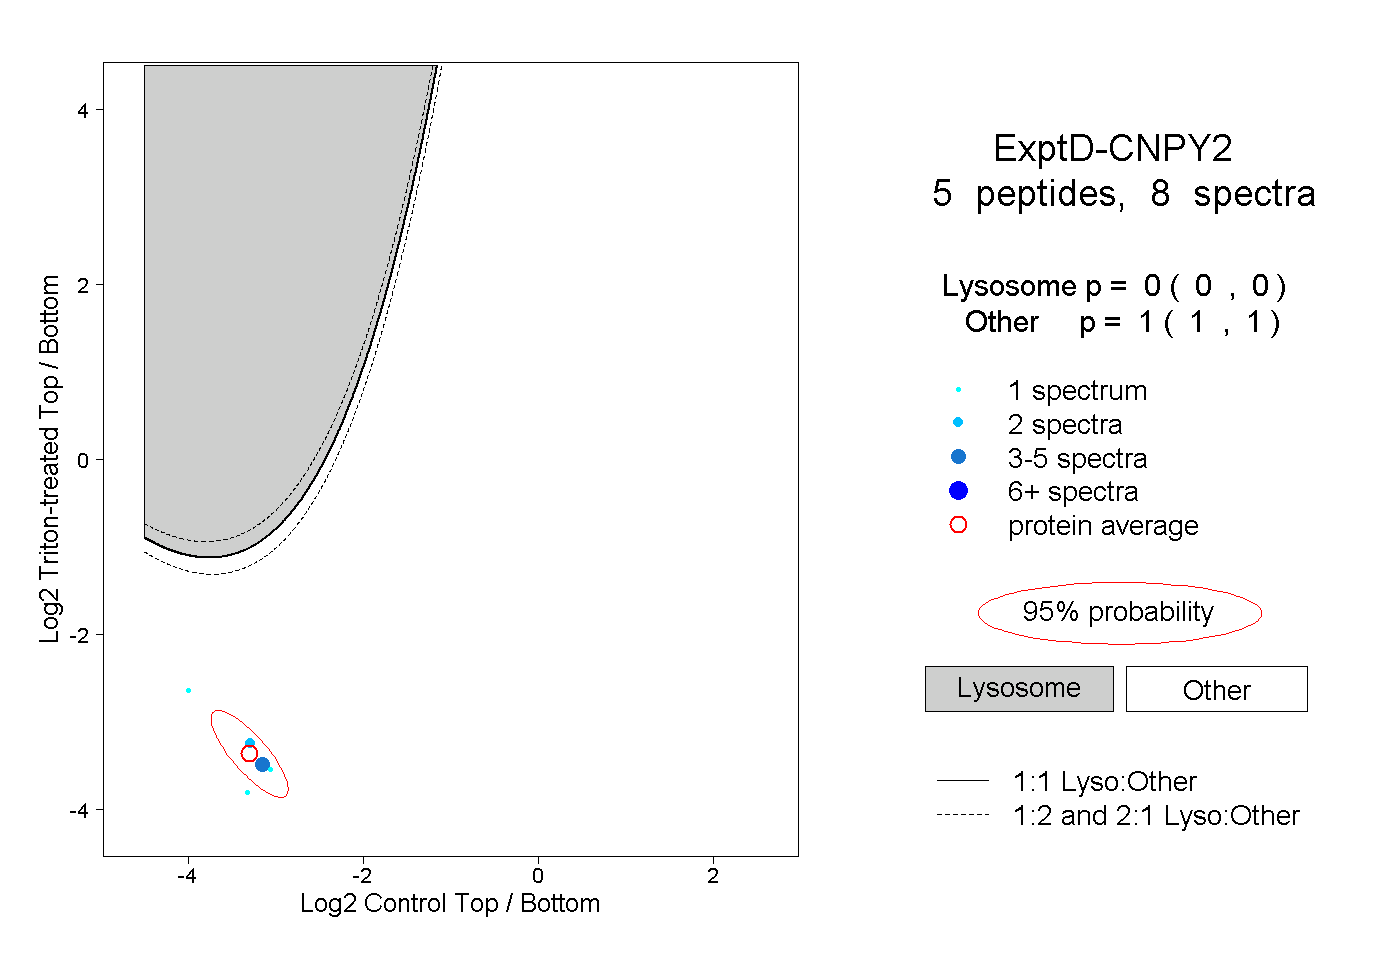
0.000 | 0.000
1.000 | 1.000