 8
8peptides
spectra
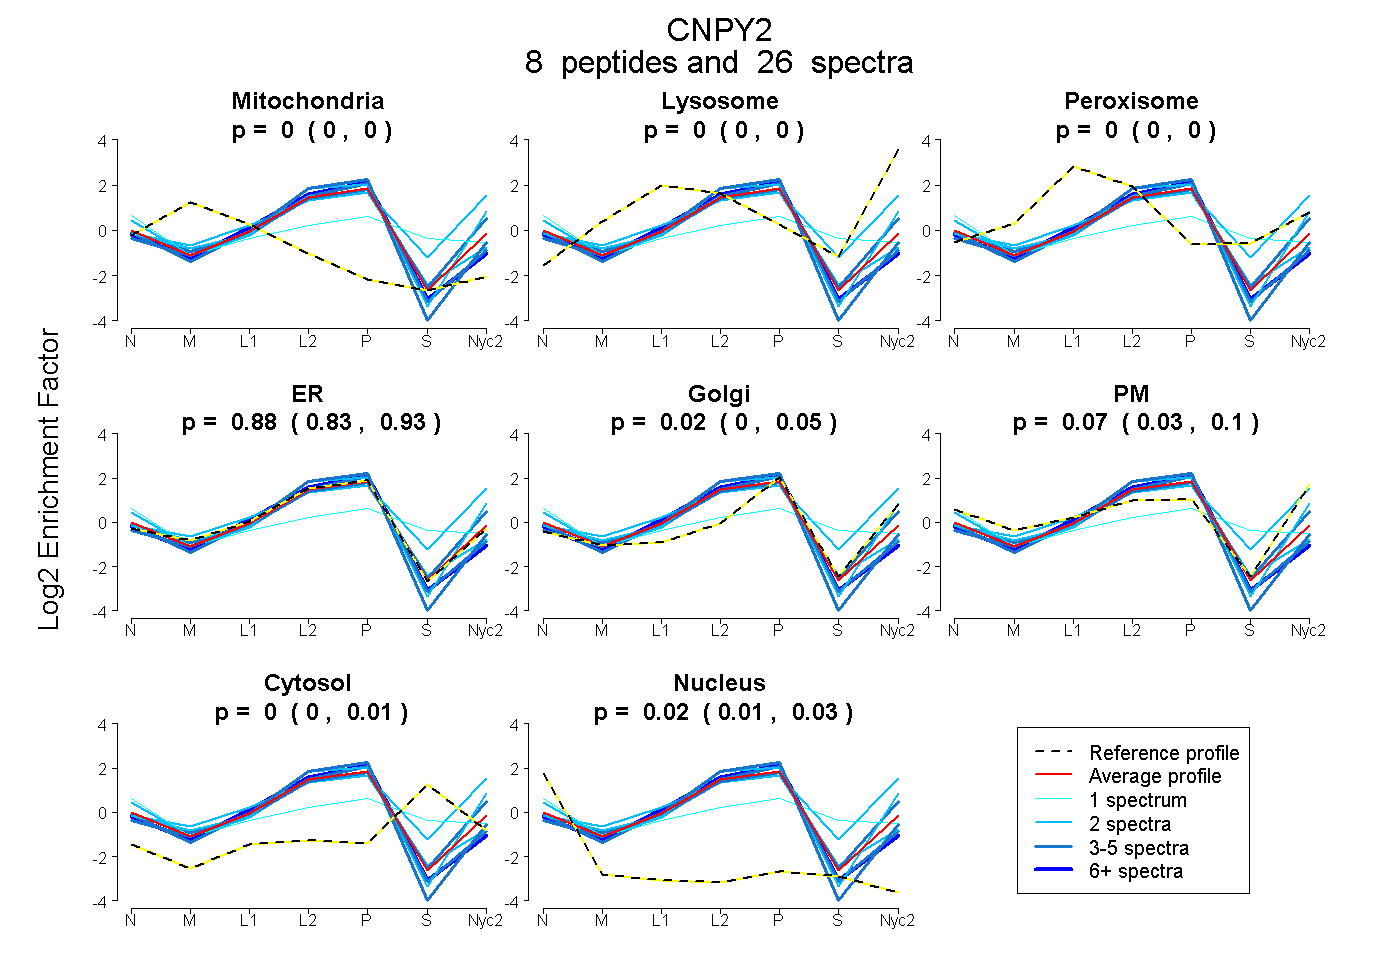
0.000 | 0.000
0.000 | 0.000
0.000 | 0.000
0.833 | 0.926
0.000 | 0.053
0.029 | 0.102
0.000 | 0.009
0.009 | 0.029
| Plot | Mito | Lyso | Perox | ER | Golgi | PM | Cytosol | Nucleus | |||||
| Expt A |
8 peptides |
26 spectra |
|
0.000 0.000 | 0.000 |
0.000 0.000 | 0.000 |
0.000 0.000 | 0.000 |
0.884 0.833 | 0.926 |
0.023 0.000 | 0.053 |
0.072 0.029 | 0.102 |
0.000 0.000 | 0.009 |
0.021 0.009 | 0.029 |
| 5 spectra, TIQMGSFR | 0.000 | 0.000 | 0.000 | 1.000 | 0.000 | 0.000 | 0.000 | 0.000 | ||
| 4 spectra, INPDGSQSVVEVPYAR | 0.000 | 0.003 | 0.000 | 0.621 | 0.123 | 0.253 | 0.000 | 0.000 | ||
| 2 spectra, NGGSSELDLQGIR | 0.000 | 0.000 | 0.000 | 0.686 | 0.000 | 0.314 | 0.000 | 0.000 | ||
| 2 spectra, EYGEQIDPSTHR | 0.000 | 0.258 | 0.000 | 0.256 | 0.165 | 0.263 | 0.059 | 0.000 | ||
| 1 spectrum, SQDLHCGACR | 0.000 | 0.000 | 0.089 | 0.298 | 0.000 | 0.215 | 0.324 | 0.074 | ||
| 4 spectra, EADNVK | 0.000 | 0.000 | 0.000 | 0.953 | 0.000 | 0.000 | 0.000 | 0.047 | ||
| 2 spectra, IDSDISGTLK | 0.000 | 0.000 | 0.000 | 0.918 | 0.000 | 0.000 | 0.000 | 0.082 | ||
| 6 spectra, ALVDELEWEIAR | 0.000 | 0.000 | 0.000 | 0.966 | 0.000 | 0.000 | 0.000 | 0.034 |
| Plot | Mito | Lyso or Perox | ER | Golgi | PM | Cytosol | Nucleus | ||||||
| Expt B |
6 peptides |
8 spectra |
 |
0.000 0.000 | 0.000 |
0.030 0.000 | 0.113 |
0.889 0.672 | 0.925 |
0.000 0.000 | 0.154 |
0.000 0.000 | 0.033 |
0.061 0.000 | 0.099 |
0.020 0.000 | 0.050 |
|||
| Plot | Lyso | Other | |||||||||||
| Expt C |
8 peptides |
48 spectra |
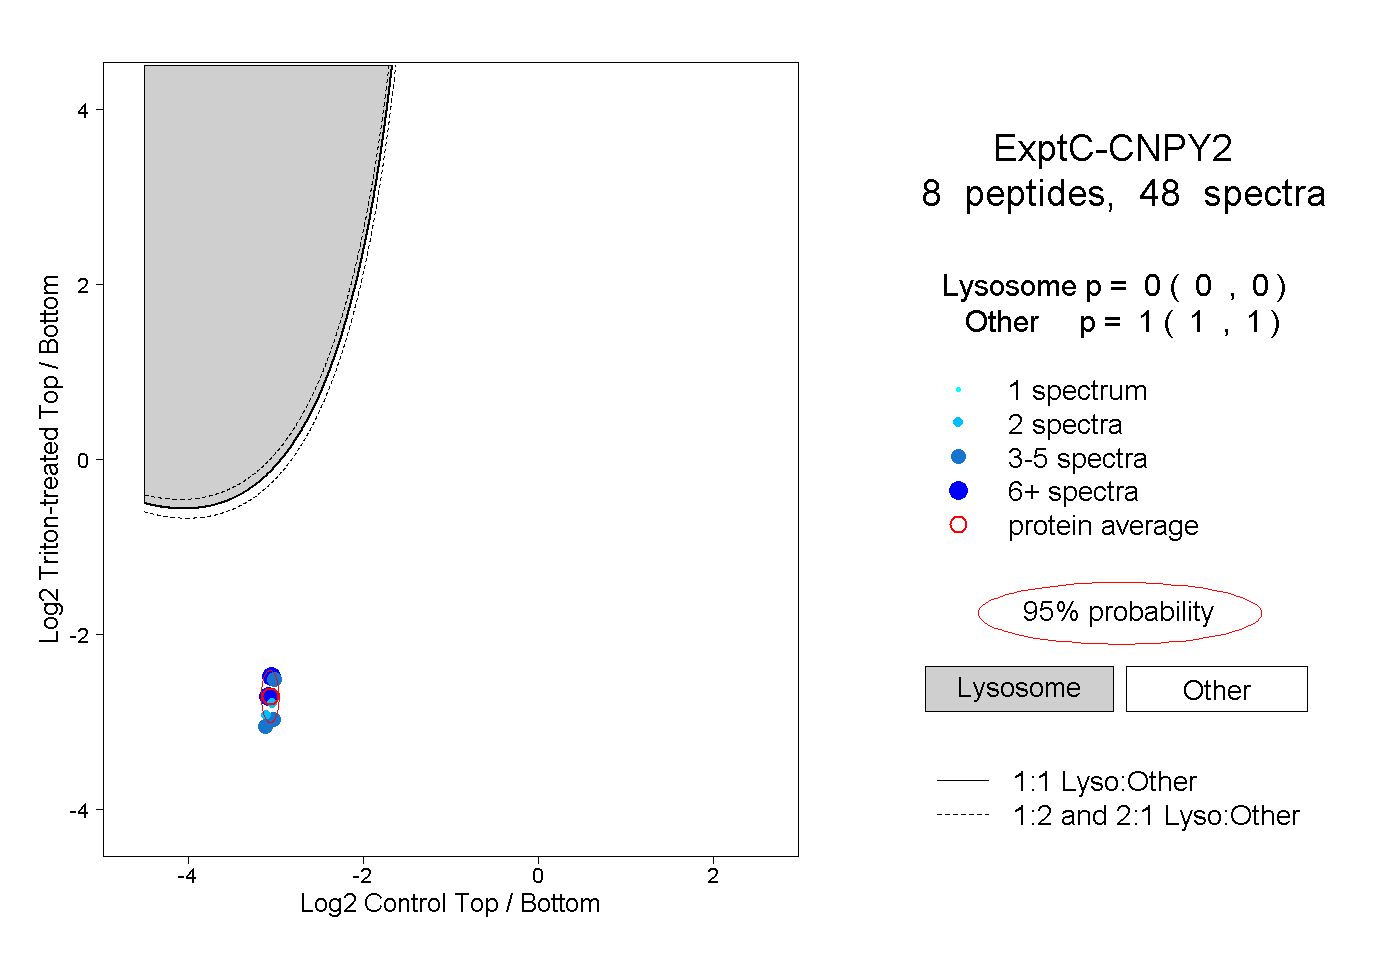 |
0.000 0.000 | 0.000 |
1.000 1.000 | 1.000 |
||||||||
| Plot | Lyso | Other | |||||||||||
| Expt D |
5 peptides |
8 spectra |
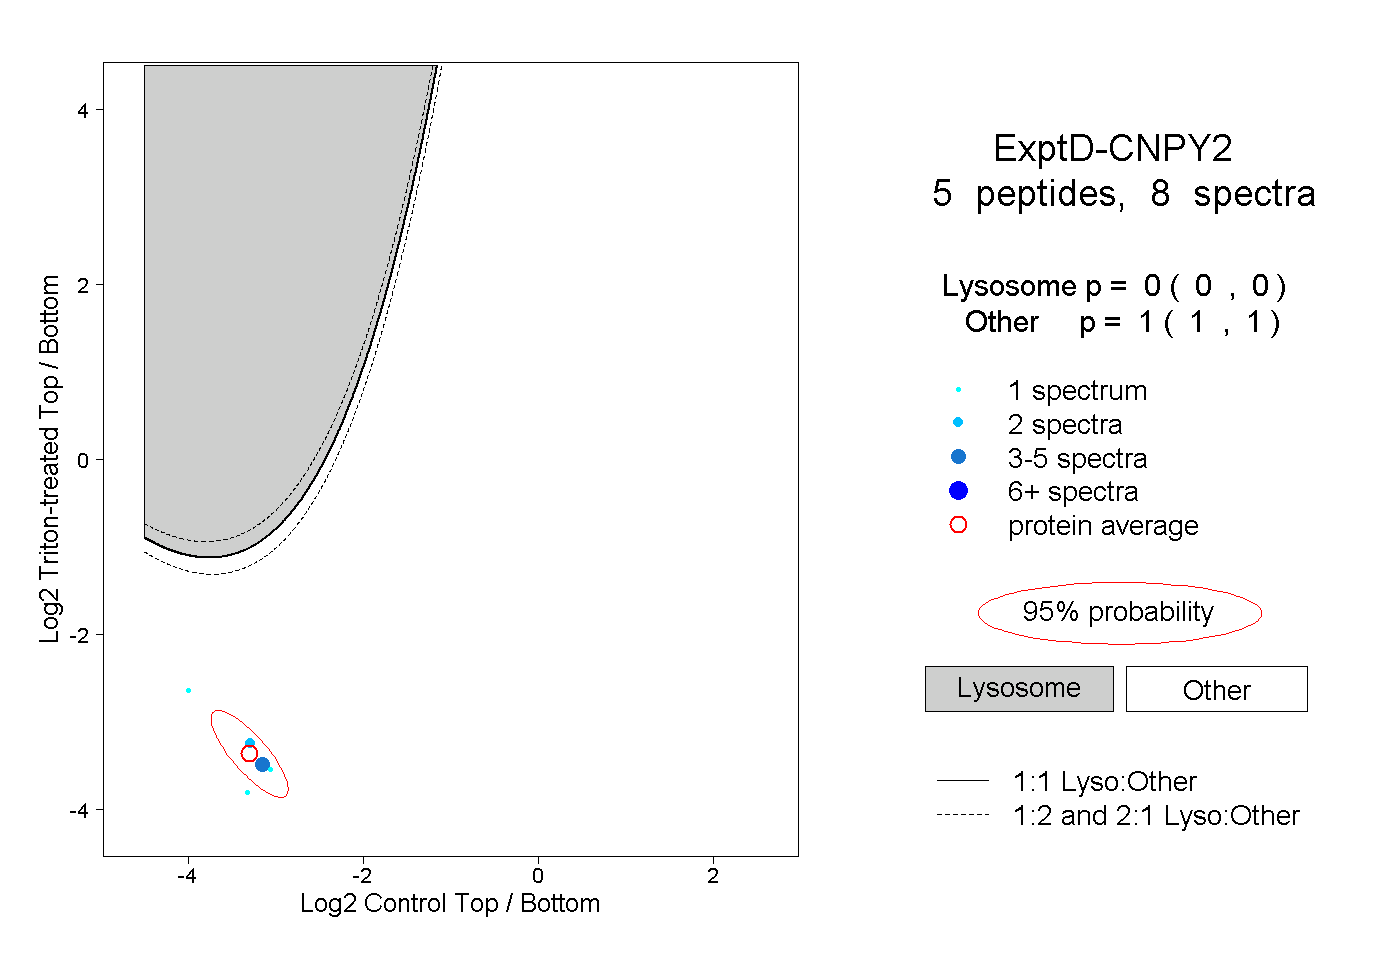 |
0.000 0.000 | 0.000 |
1.000 1.000 | 1.000 |