 12
12peptides
spectra

0.000 | 0.000
0.139 | 0.159
0.000 | 0.000
0.000 | 0.000
0.000 | 0.013
0.000 | 0.014
0.833 | 0.848
0.000 | 0.000
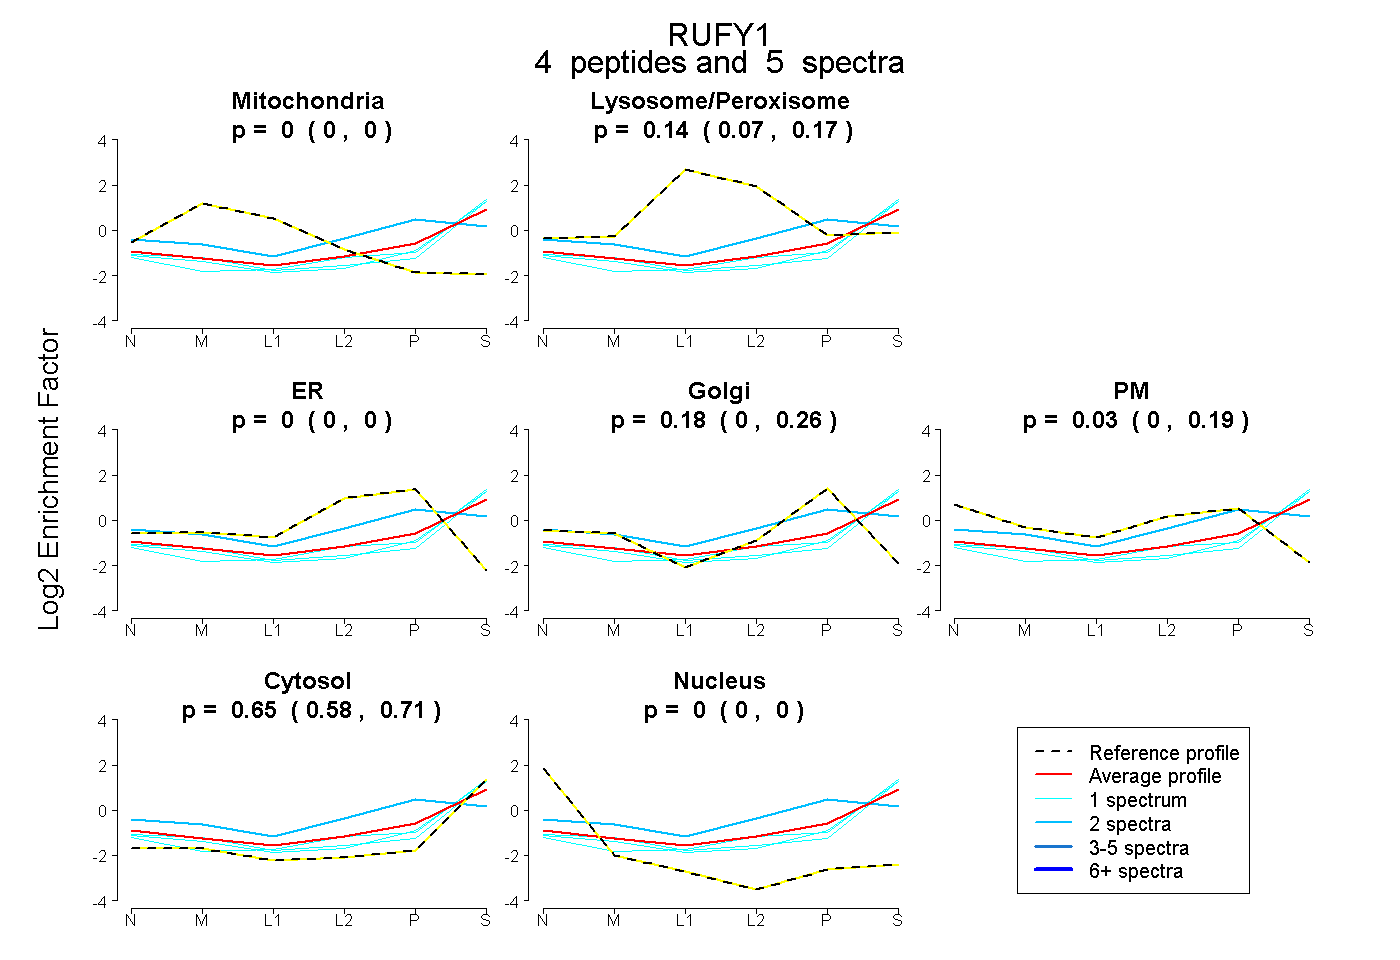
4peptides
spectra
0.000 | 0.000
0.075 | 0.171
0.000 | 0.000
0.000 | 0.258
0.000 | 0.189
0.582 | 0.706
0.000 | 0.000
12peptides
spectra
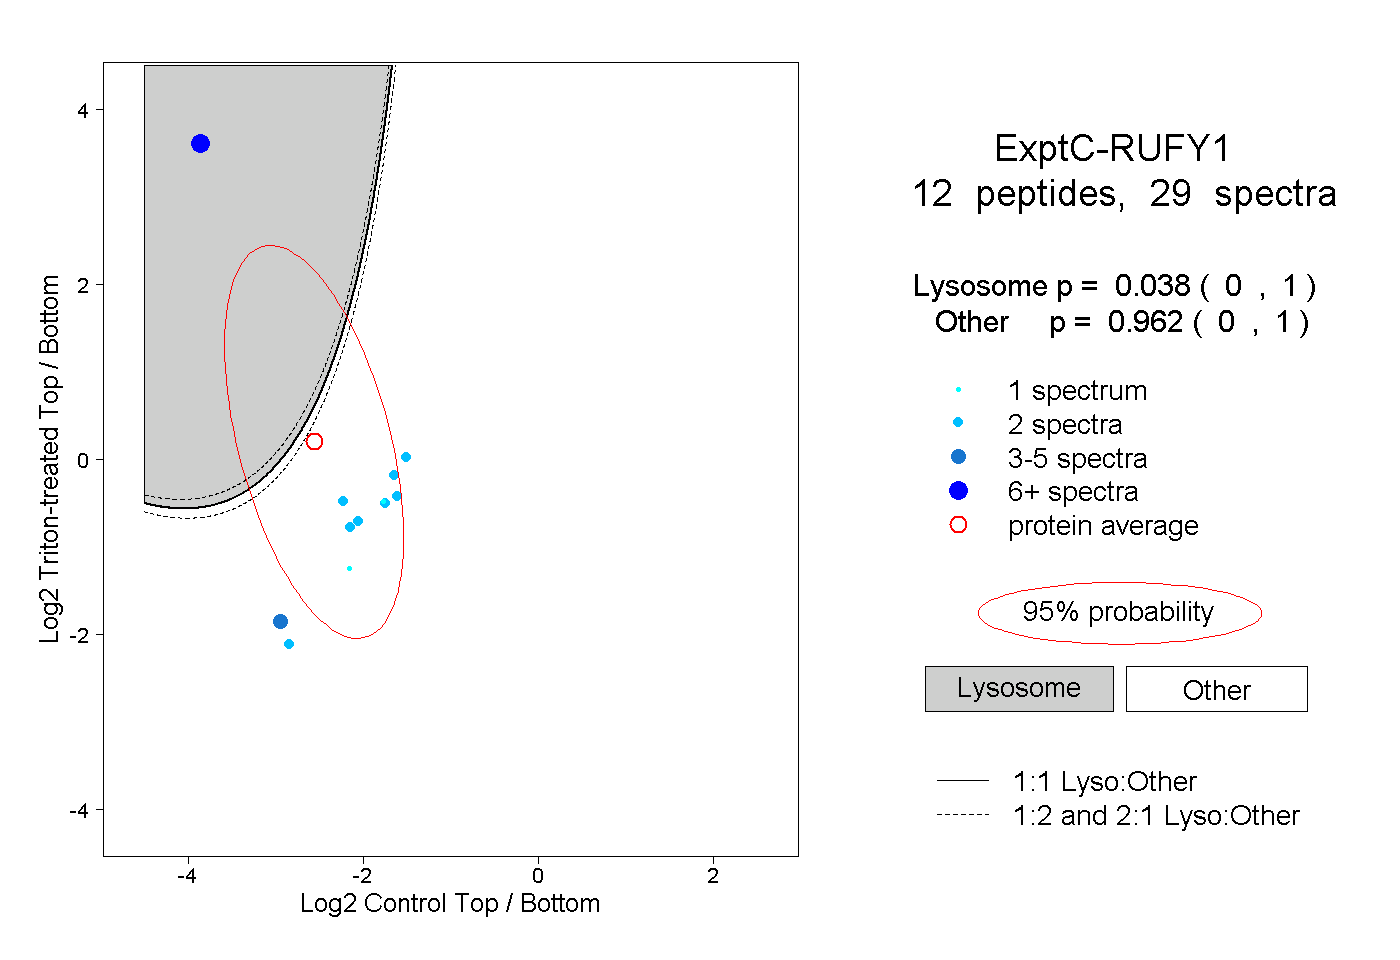
0.000 | 1.000
0.000 | 1.000
2peptides
spectra
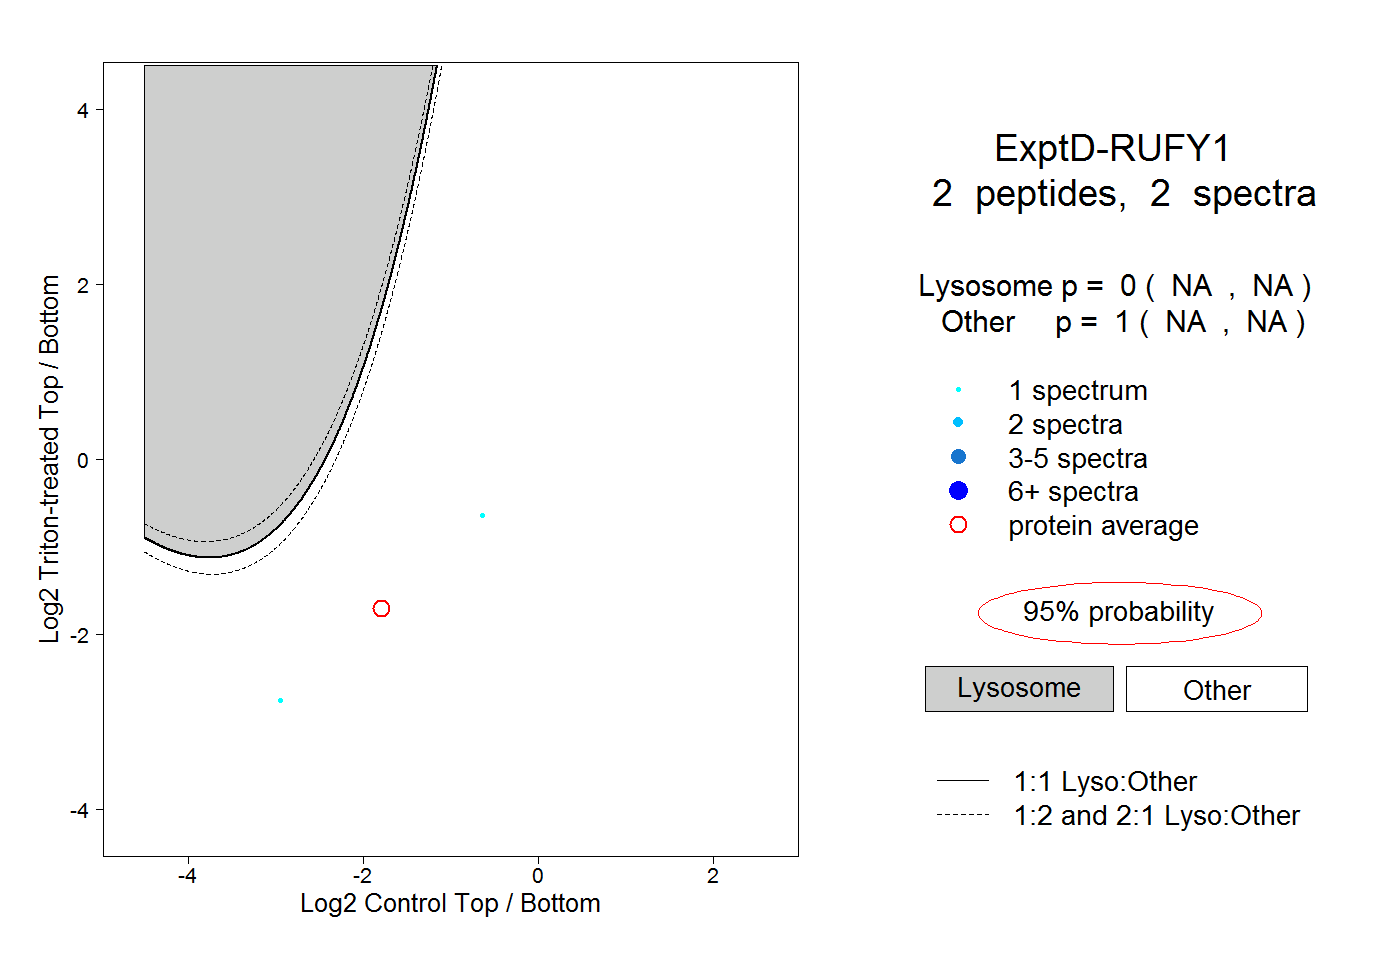
NA | NA
NA | NA