 12
12peptides
spectra

0.000 | 0.000
0.139 | 0.159
0.000 | 0.000
0.000 | 0.000
0.000 | 0.013
0.000 | 0.014
0.833 | 0.848
0.000 | 0.000
| Plot | Mito | Lyso | Perox | ER | Golgi | PM | Cytosol | Nucleus | |||||
| Expt A |
12 peptides |
22 spectra |
|
0.000 0.000 | 0.000 |
0.149 0.139 | 0.159 |
0.000 0.000 | 0.000 |
0.000 0.000 | 0.000 |
0.000 0.000 | 0.013 |
0.008 0.000 | 0.014 |
0.842 0.833 | 0.848 |
0.000 0.000 | 0.000 |
| 2 spectra, VLLQSALSLGR | 0.000 | 0.172 | 0.000 | 0.000 | 0.000 | 0.000 | 0.828 | 0.000 | ||
| 2 spectra, LQEELSAATDR | 0.000 | 0.128 | 0.000 | 0.000 | 0.000 | 0.000 | 0.872 | 0.000 | ||
| 2 spectra, LCPEASDIATSVR | 0.000 | 0.000 | 0.000 | 0.000 | 0.000 | 0.000 | 1.000 | 0.000 | ||
| 3 spectra, ITDVLDQK | 0.000 | 0.128 | 0.000 | 0.014 | 0.032 | 0.000 | 0.826 | 0.000 | ||
| 1 spectrum, NYVEELNR | 0.000 | 0.194 | 0.000 | 0.000 | 0.104 | 0.069 | 0.633 | 0.000 | ||
| 2 spectra, LQQELSGR | 0.000 | 0.168 | 0.000 | 0.000 | 0.000 | 0.000 | 0.832 | 0.000 | ||
| 1 spectrum, AAESWSAPILTLAR | 0.000 | 0.047 | 0.000 | 0.000 | 0.000 | 0.000 | 0.953 | 0.000 | ||
| 1 spectrum, AAAGLGDGGGGGGER | 0.000 | 0.065 | 0.000 | 0.000 | 0.000 | 0.000 | 0.935 | 0.000 | ||
| 1 spectrum, SQLPSPGELR | 0.000 | 0.207 | 0.019 | 0.000 | 0.032 | 0.000 | 0.741 | 0.000 | ||
| 2 spectra, DVQDLDSGR | 0.000 | 0.119 | 0.000 | 0.000 | 0.000 | 0.000 | 0.881 | 0.000 | ||
| 4 spectra, AINLQMFHK | 0.000 | 0.142 | 0.058 | 0.003 | 0.000 | 0.064 | 0.733 | 0.000 | ||
| 1 spectrum, QQLEEVK | 0.091 | 0.000 | 0.176 | 0.146 | 0.043 | 0.000 | 0.544 | 0.000 |
| Plot | Mito | Lyso or Perox | ER | Golgi | PM | Cytosol | Nucleus | ||||||
| Expt B |
4 peptides |
5 spectra |
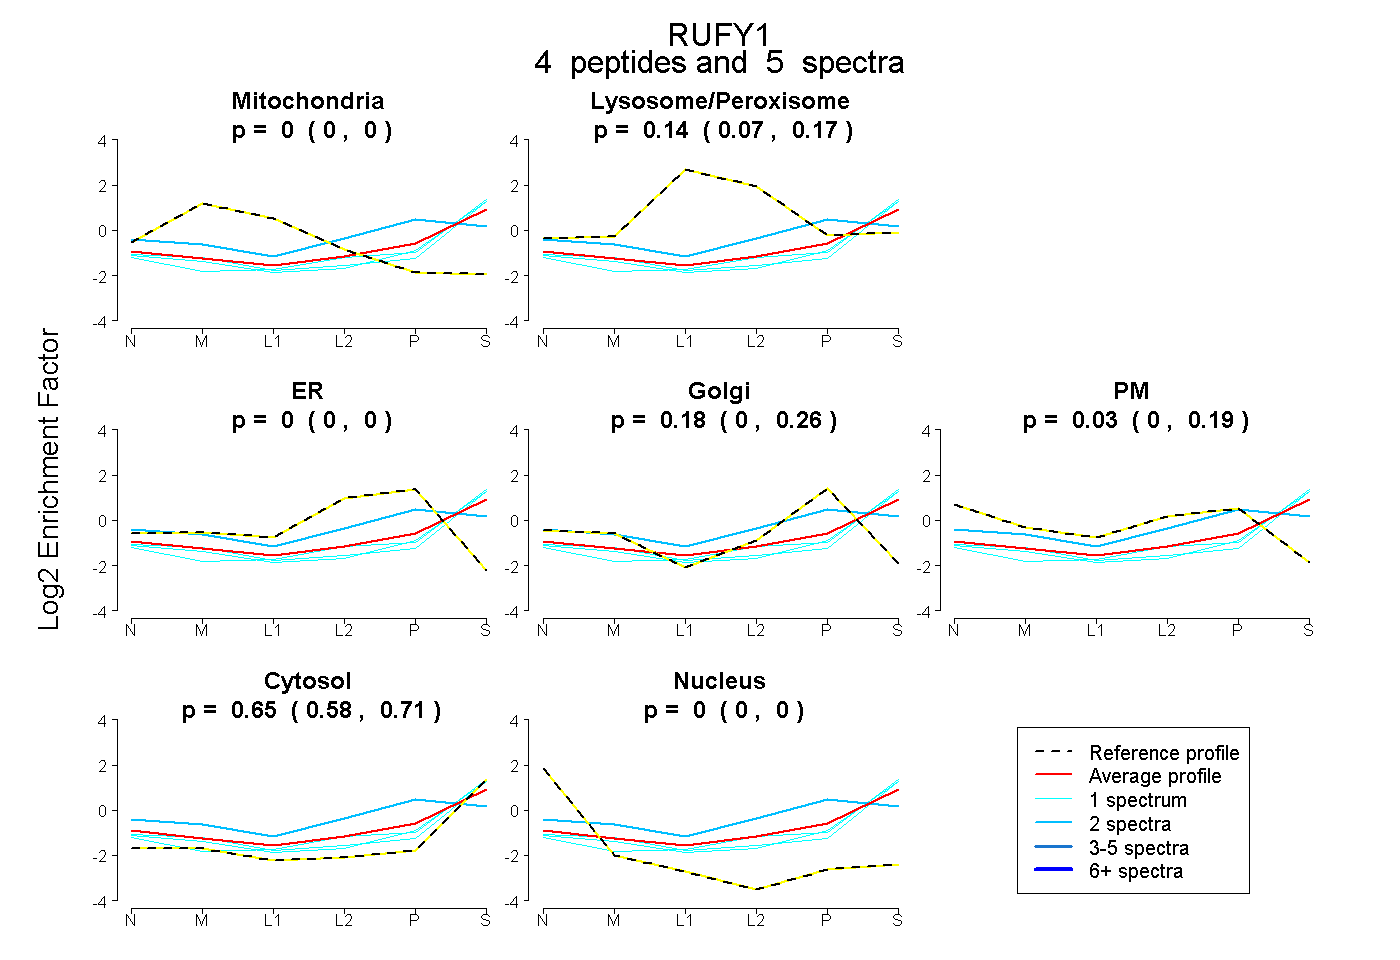 |
0.000 0.000 | 0.000 |
0.140 0.075 | 0.171 |
0.000 0.000 | 0.000 |
0.177 0.000 | 0.258 |
0.034 0.000 | 0.189 |
0.649 0.582 | 0.706 |
0.000 0.000 | 0.000 |
|||
| Plot | Lyso | Other | |||||||||||
| Expt C |
12 peptides |
29 spectra |
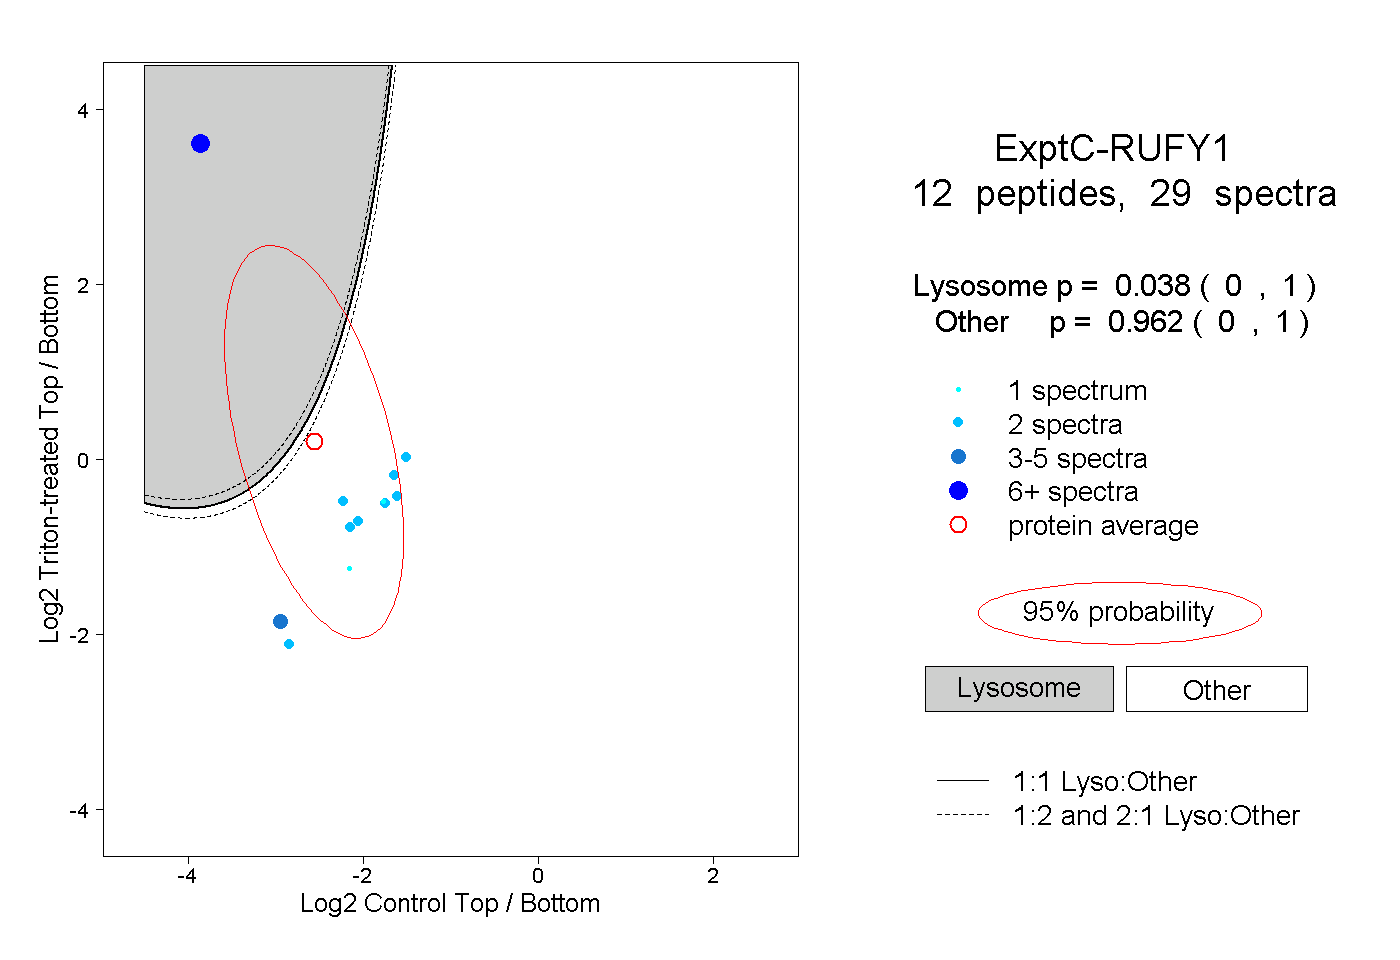 |
0.038 0.000 | 1.000 |
0.962 0.000 | 1.000 |
||||||||
| Plot | Lyso | Other | |||||||||||
| Expt D |
2 peptides |
2 spectra |
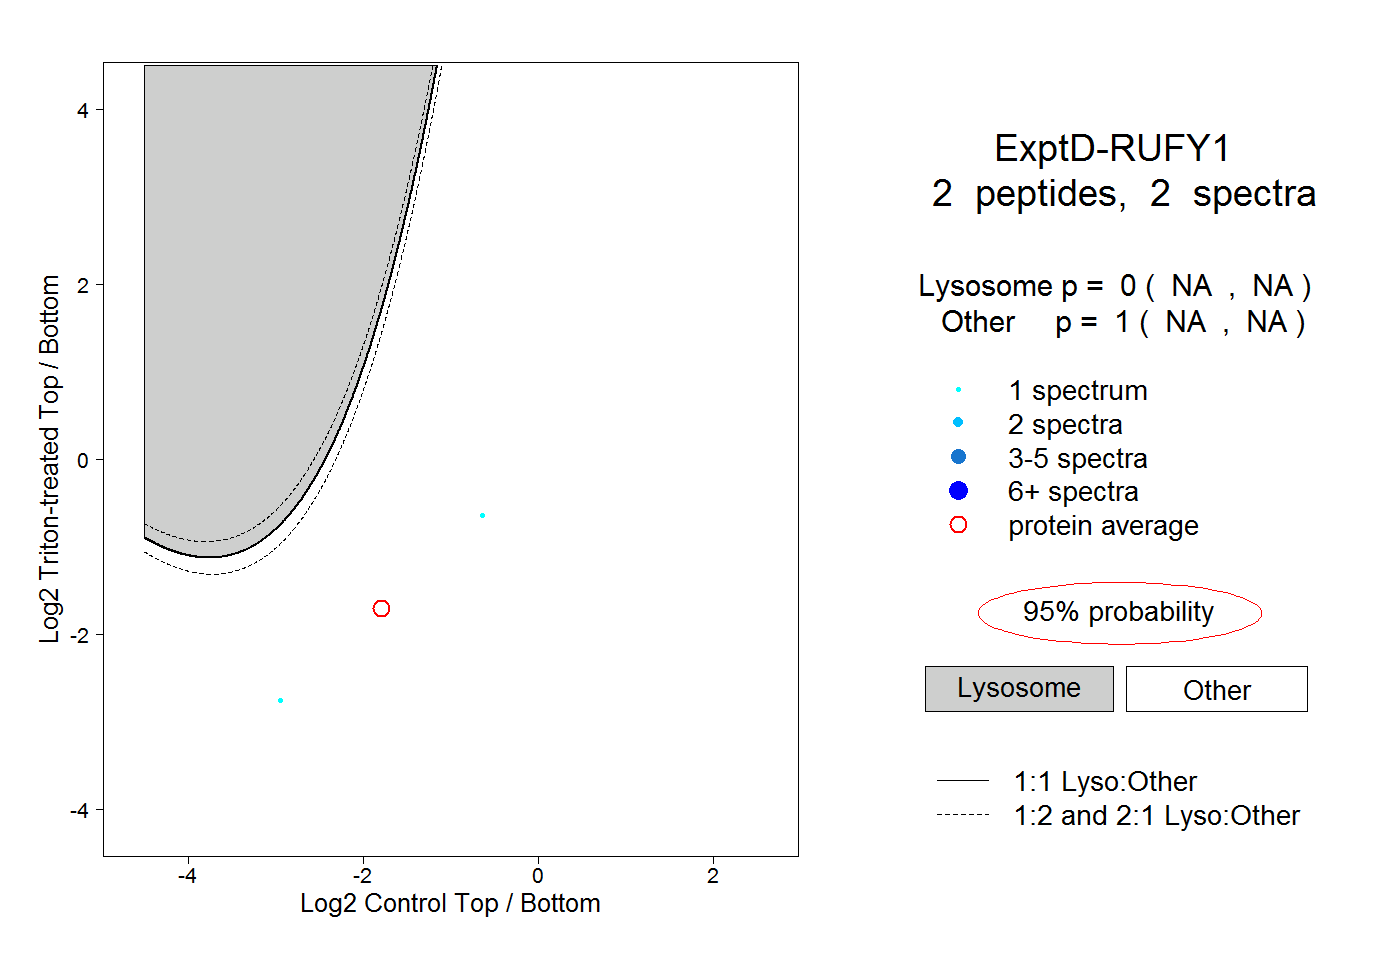 |
0.000 NA | NA |
1.000 NA | NA |