 11
11peptides
spectra
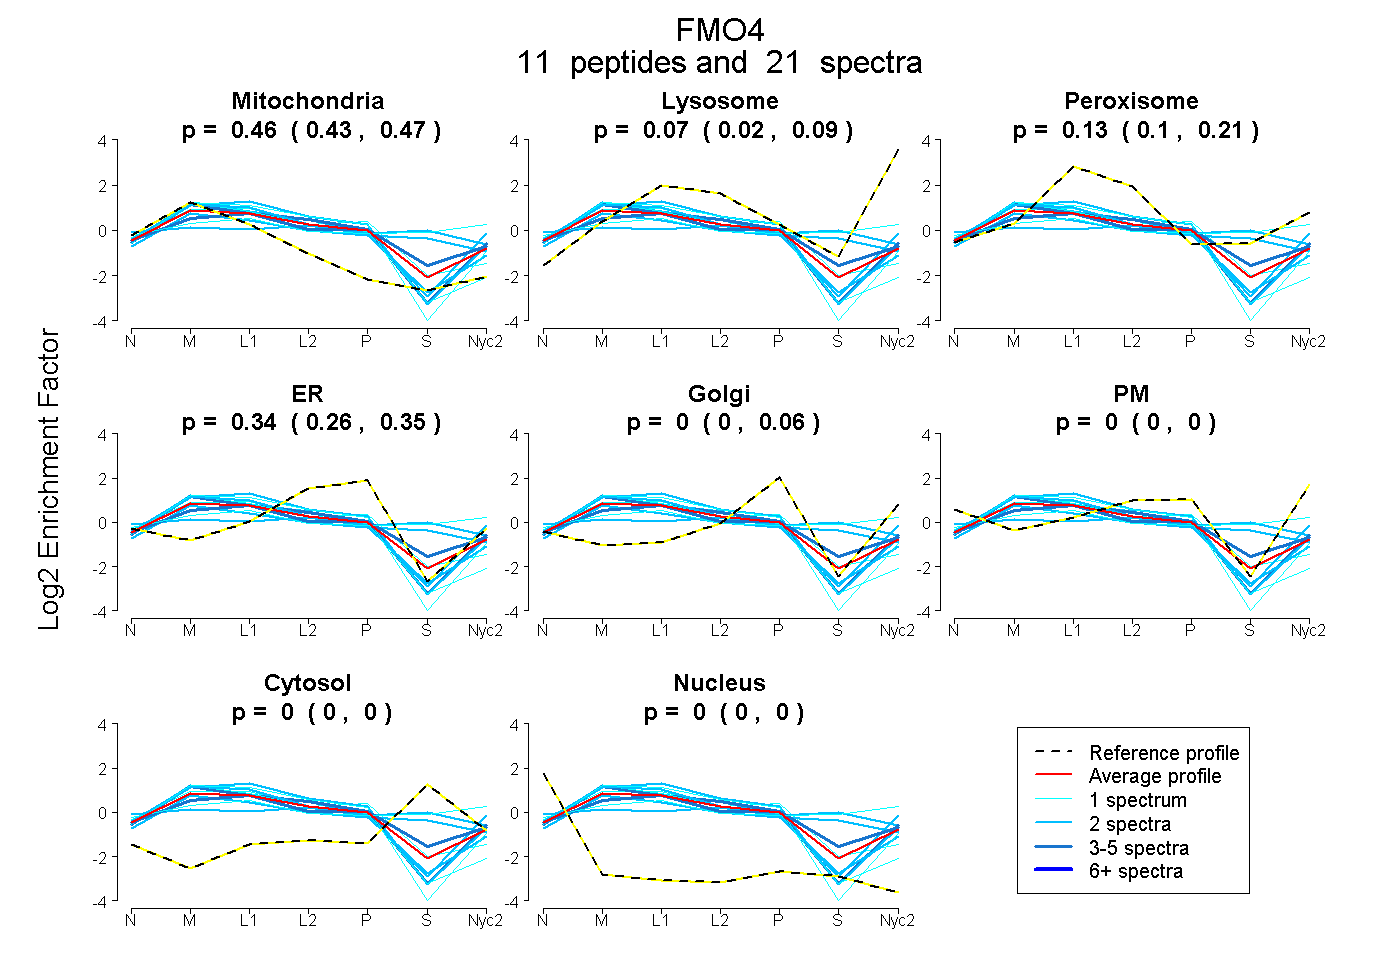
0.430 | 0.467
0.019 | 0.089
0.096 | 0.205
0.262 | 0.352
0.000 | 0.063
0.000 | 0.000
0.000 | 0.000
0.000 | 0.000
4peptides
spectra
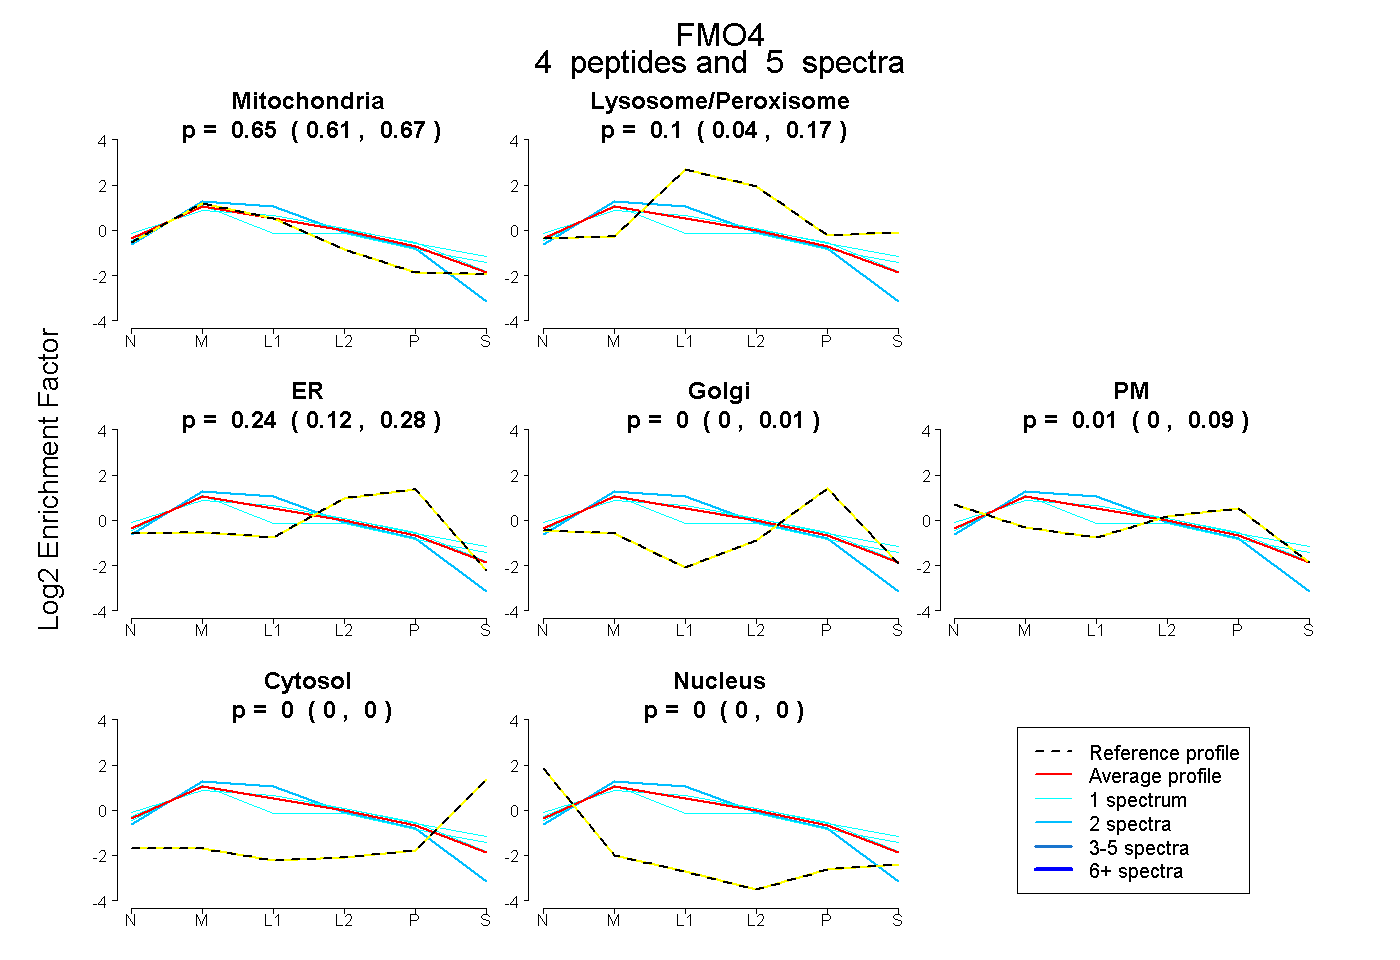
0.607 | 0.673
0.041 | 0.165
0.119 | 0.277
0.000 | 0.008
0.000 | 0.086
0.000 | 0.000
0.000 | 0.000
17peptides
spectra
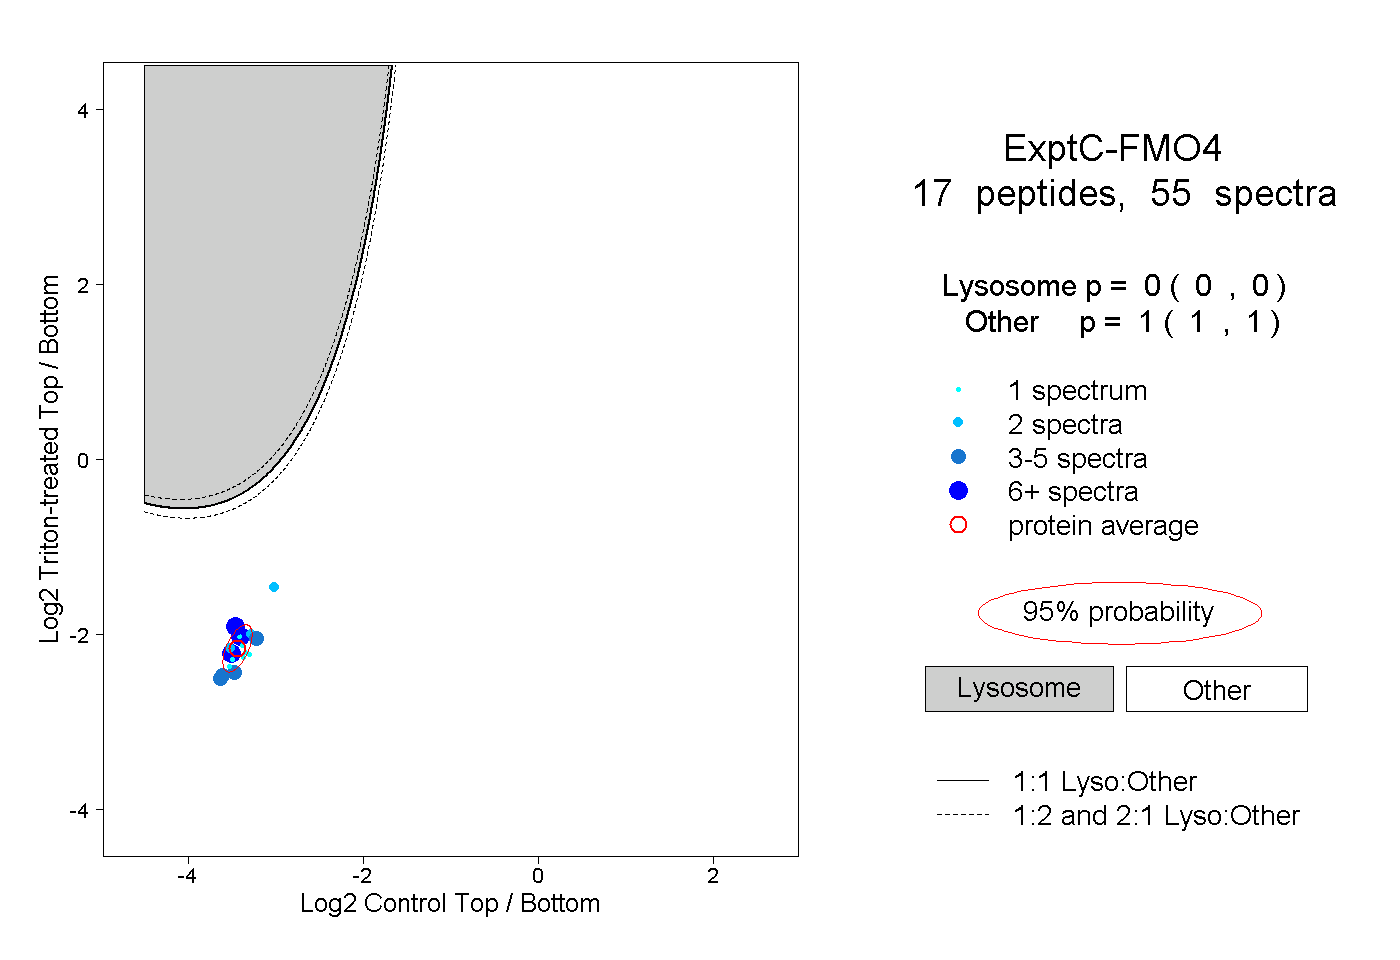
0.000 | 0.000
1.000 | 1.000
3peptides
spectra
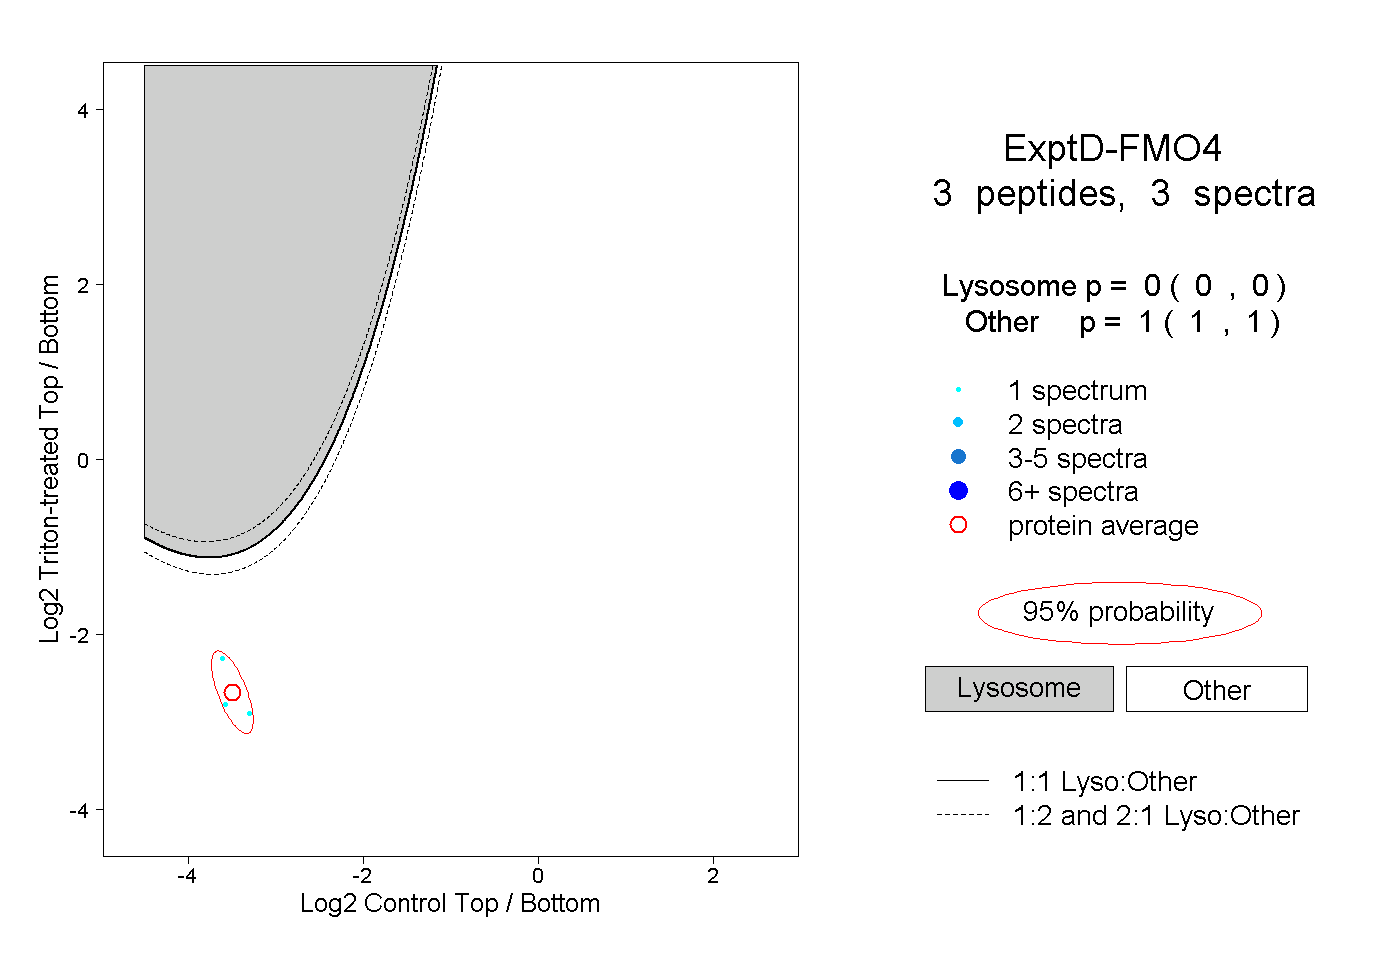
0.000 | 0.000
1.000 | 1.000