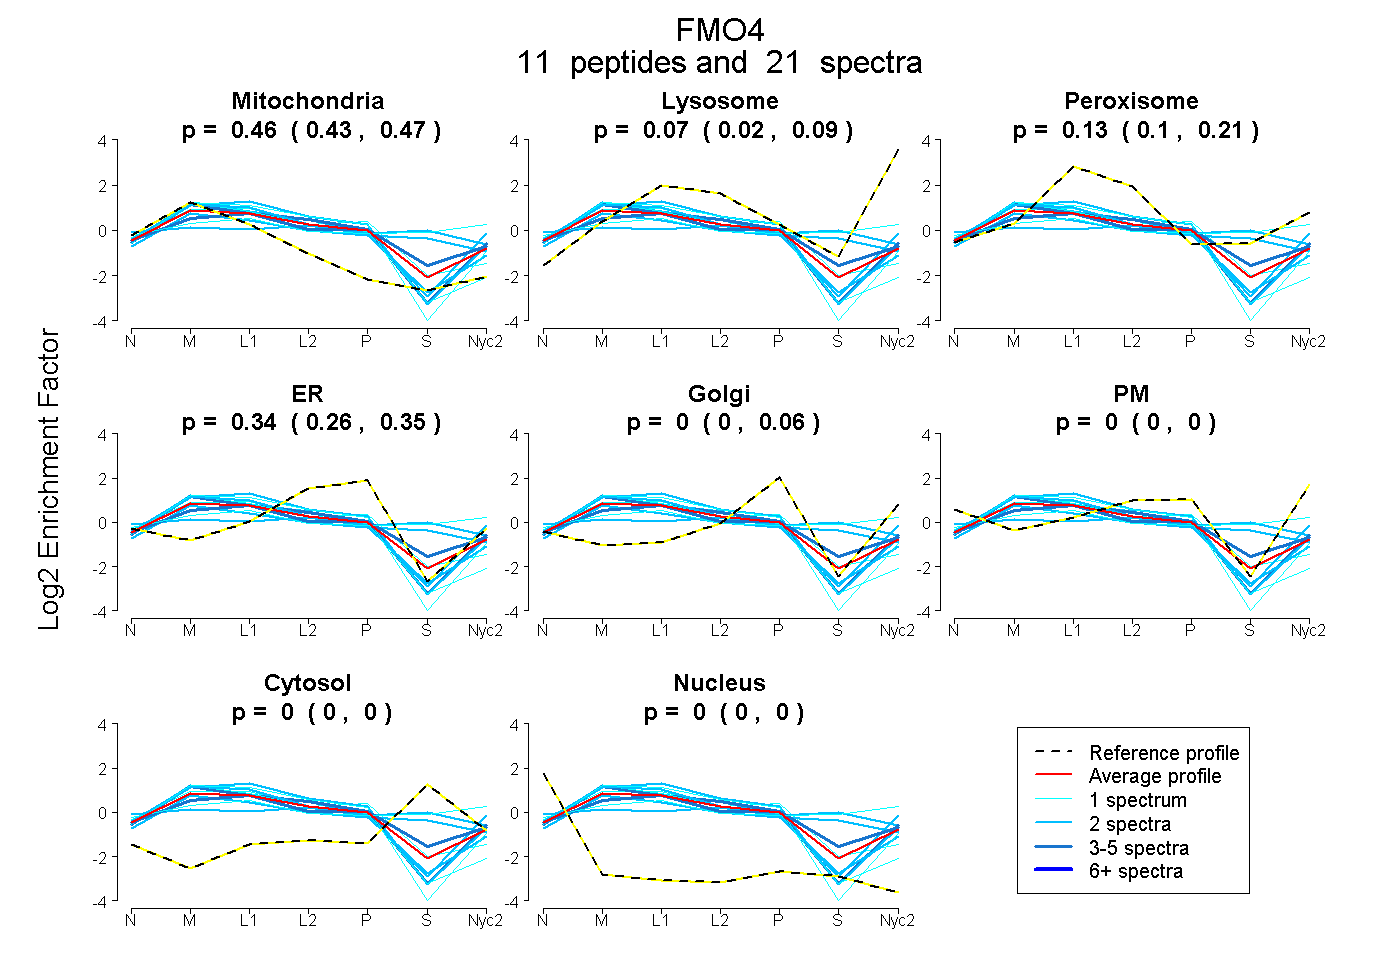
 11
11peptides
spectra
0.430 | 0.467
0.019 | 0.089
0.096 | 0.205
0.262 | 0.352
0.000 | 0.063
0.000 | 0.000
0.000 | 0.000
0.000 | 0.000
| Plot | Mito | Lyso | Perox | ER | Golgi | PM | Cytosol | Nucleus | |||||
| Expt A |
11 peptides |
21 spectra |
|
0.456 0.430 | 0.467 |
0.071 0.019 | 0.089 |
0.134 0.096 | 0.205 |
0.339 0.262 | 0.352 |
0.000 0.000 | 0.063 |
0.000 0.000 | 0.000 |
0.000 0.000 | 0.000 |
0.000 0.000 | 0.000 |
| 1 spectrum, VAVIGAGVSGLSSIK | 0.153 | 0.061 | 0.328 | 0.000 | 0.098 | 0.100 | 0.261 | 0.000 | ||
| 4 spectra, SSVGGYPLNMMQTR | 0.377 | 0.000 | 0.275 | 0.100 | 0.217 | 0.000 | 0.030 | 0.000 | ||
| 1 spectrum, EFAEHFGLLK | 0.449 | 0.000 | 0.156 | 0.395 | 0.000 | 0.000 | 0.000 | 0.000 | ||
| 1 spectrum, SLVTNVCK | 0.612 | 0.000 | 0.000 | 0.388 | 0.000 | 0.000 | 0.000 | 0.000 | ||
| 2 spectra, FVSWNQER | 0.322 | 0.000 | 0.314 | 0.076 | 0.070 | 0.000 | 0.218 | 0.000 | ||
| 2 spectra, SQEPASLSR | 0.526 | 0.028 | 0.124 | 0.322 | 0.000 | 0.000 | 0.000 | 0.000 | ||
| 3 spectra, LMGPGR | 0.482 | 0.142 | 0.000 | 0.376 | 0.000 | 0.000 | 0.000 | 0.000 | ||
| 2 spectra, GQILHSQEYR | 0.181 | 0.000 | 0.267 | 0.149 | 0.002 | 0.074 | 0.327 | 0.000 | ||
| 2 spectra, FAEASEDGMTR | 0.475 | 0.235 | 0.000 | 0.263 | 0.000 | 0.027 | 0.000 | 0.000 | ||
| 1 spectrum, SSDFGGLWK | 0.479 | 0.061 | 0.000 | 0.460 | 0.000 | 0.000 | 0.000 | 0.000 | ||
| 2 spectra, LPLESFPGIHK | 0.428 | 0.105 | 0.062 | 0.405 | 0.000 | 0.000 | 0.000 | 0.000 |
| Plot | Mito | Lyso or Perox | ER | Golgi | PM | Cytosol | Nucleus | ||||||
| Expt B |
4 peptides |
5 spectra |
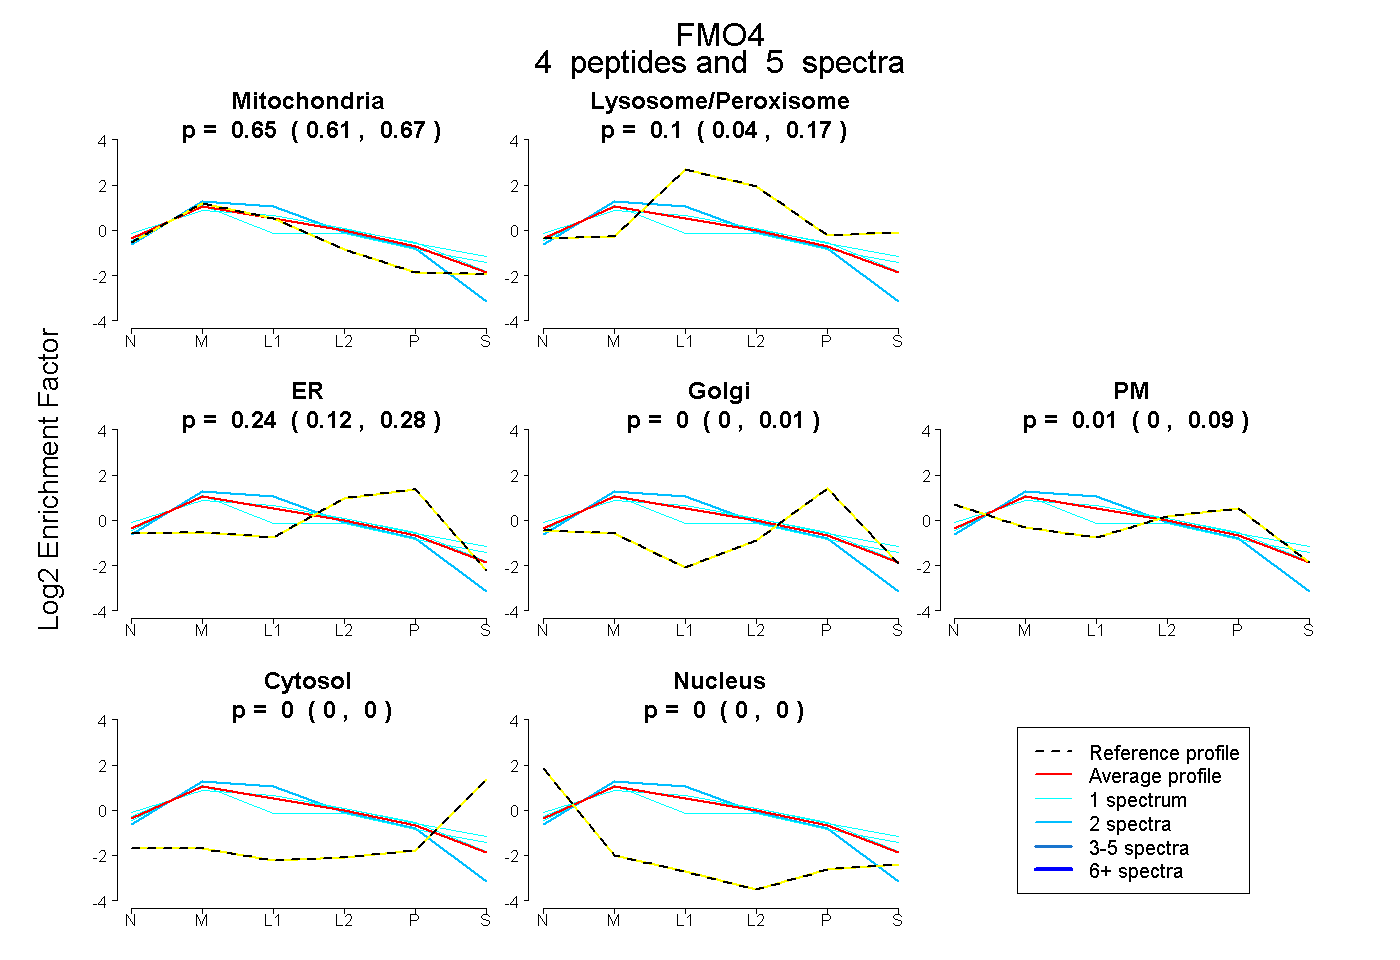 |
0.651 0.607 | 0.673 |
0.103 0.041 | 0.165 |
0.236 0.119 | 0.277 |
0.000 0.000 | 0.008 |
0.009 0.000 | 0.086 |
0.000 0.000 | 0.000 |
0.000 0.000 | 0.000 |
|||
| Plot | Lyso | Other | |||||||||||
| Expt C |
17 peptides |
55 spectra |
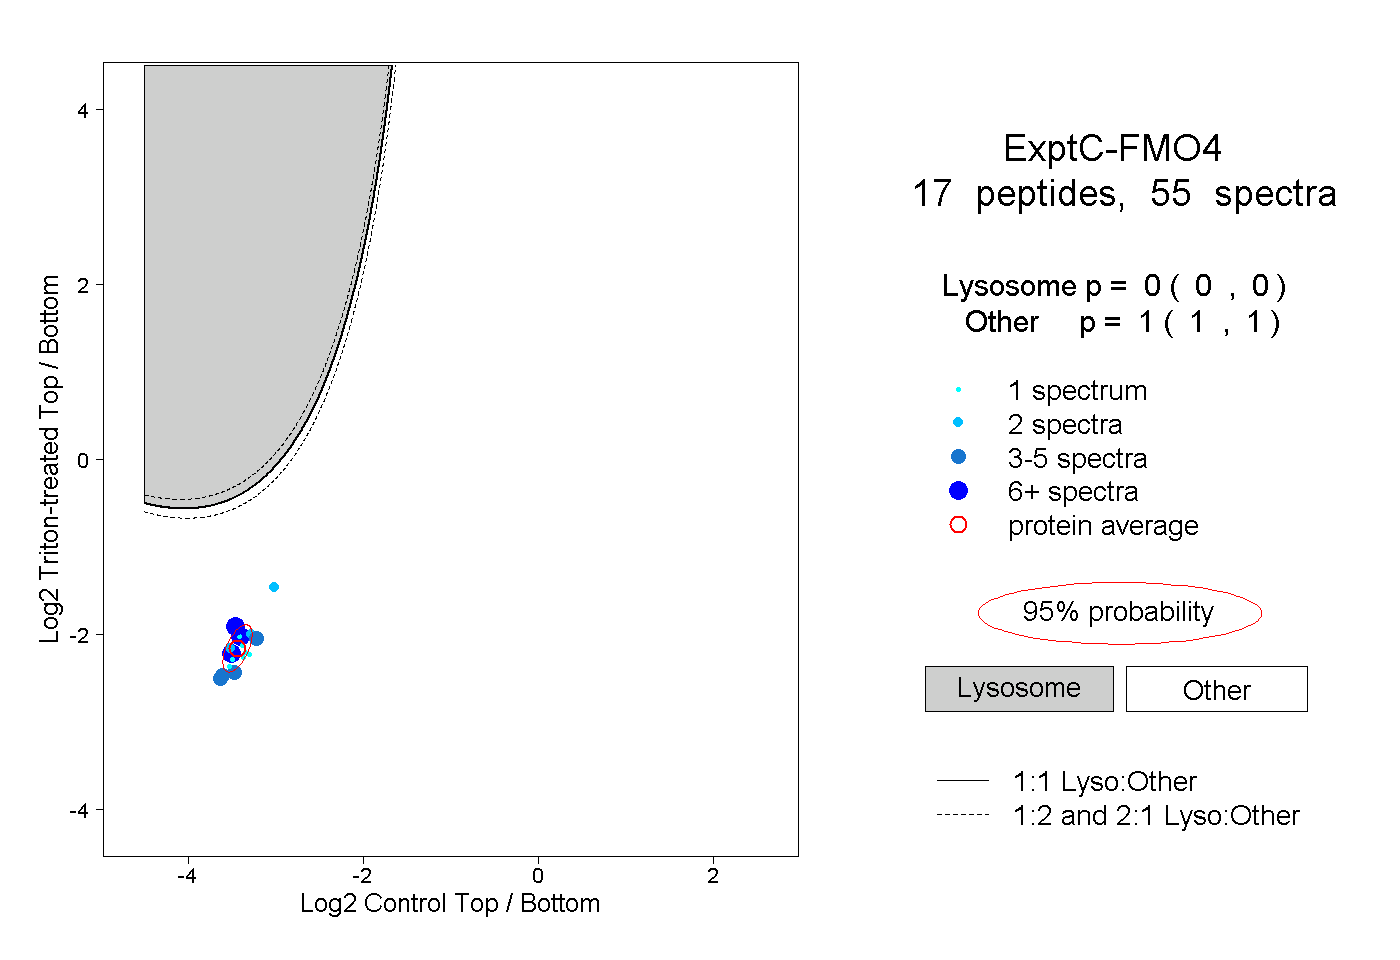 |
0.000 0.000 | 0.000 |
1.000 1.000 | 1.000 |
||||||||
| Plot | Lyso | Other | |||||||||||
| Expt D |
3 peptides |
3 spectra |
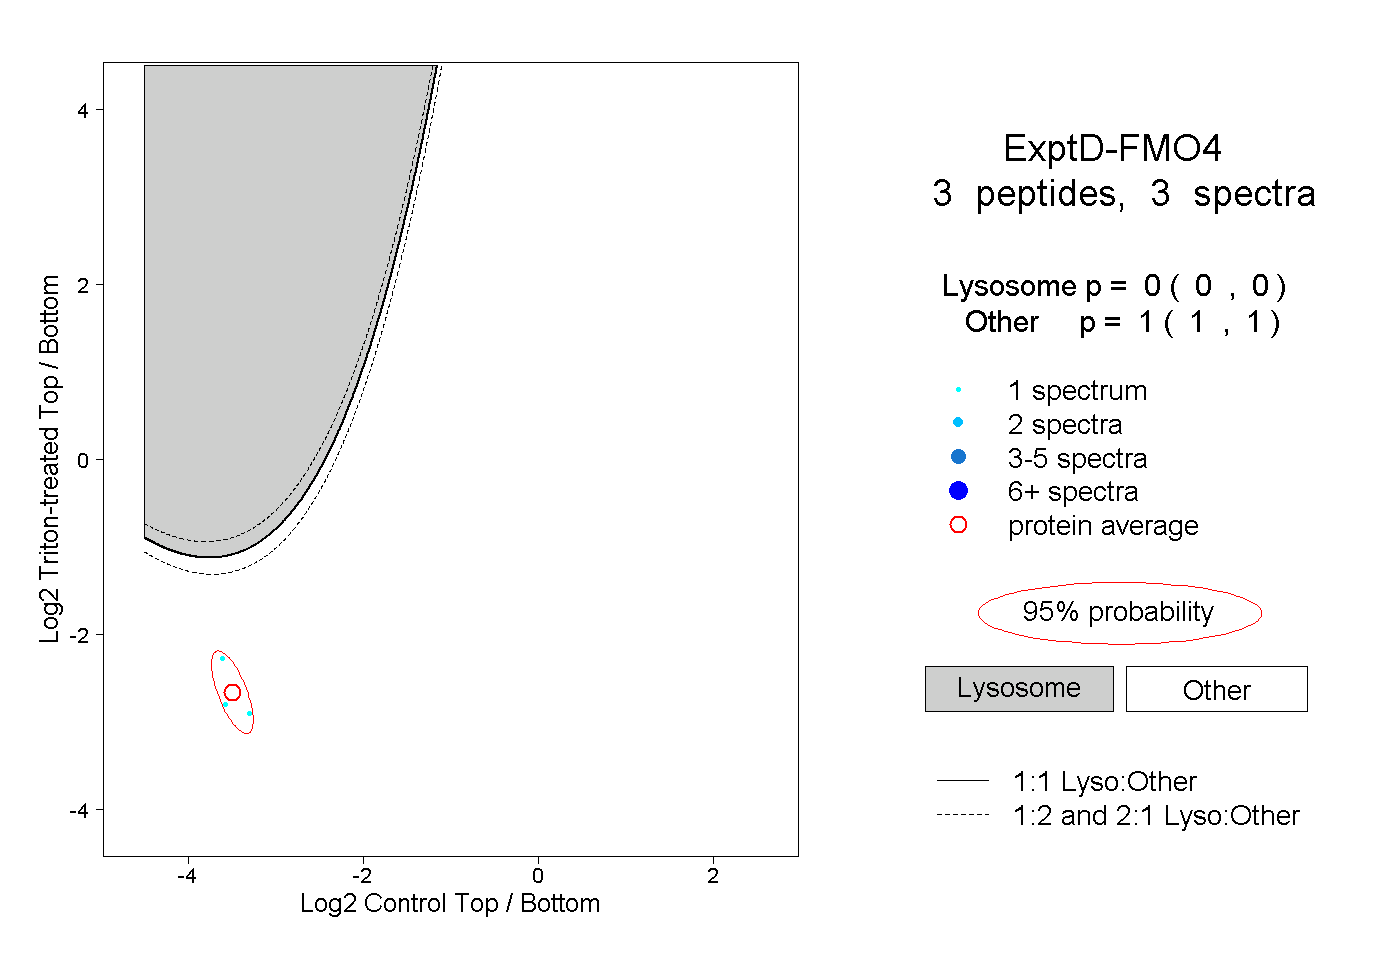 |
0.000 0.000 | 0.000 |
1.000 1.000 | 1.000 |