 11
11peptides
spectra
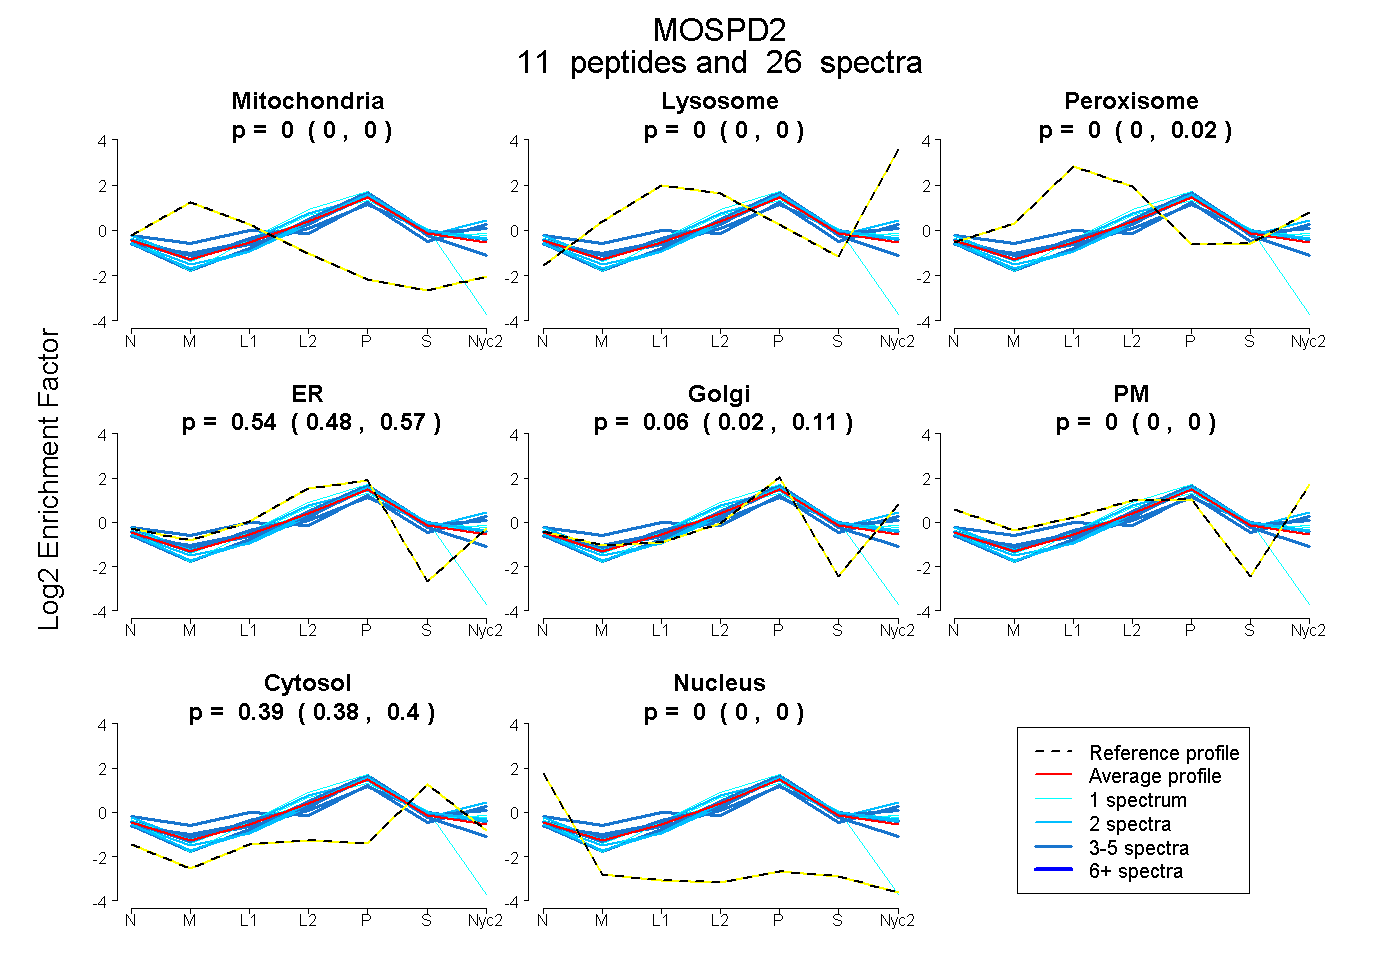
0.000 | 0.000
0.000 | 0.000
0.000 | 0.019
0.479 | 0.570
0.024 | 0.112
0.000 | 0.000
0.379 | 0.401
0.000 | 0.000
4peptides
spectra
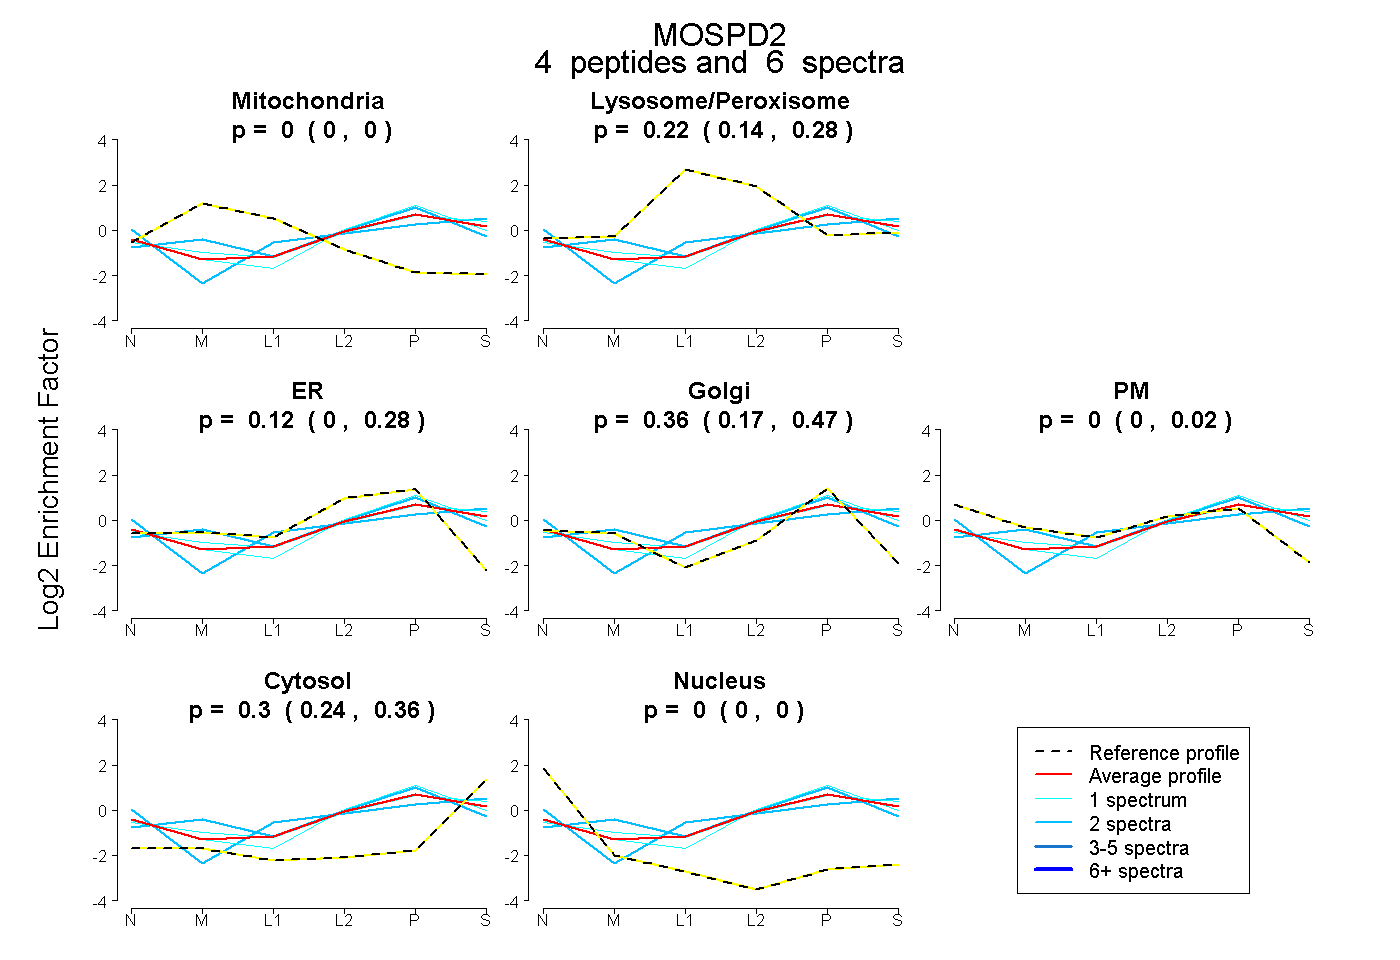
0.000 | 0.000
0.136 | 0.280
0.000 | 0.276
0.166 | 0.473
0.000 | 0.016
0.239 | 0.362
0.000 | 0.000
11peptides
spectra
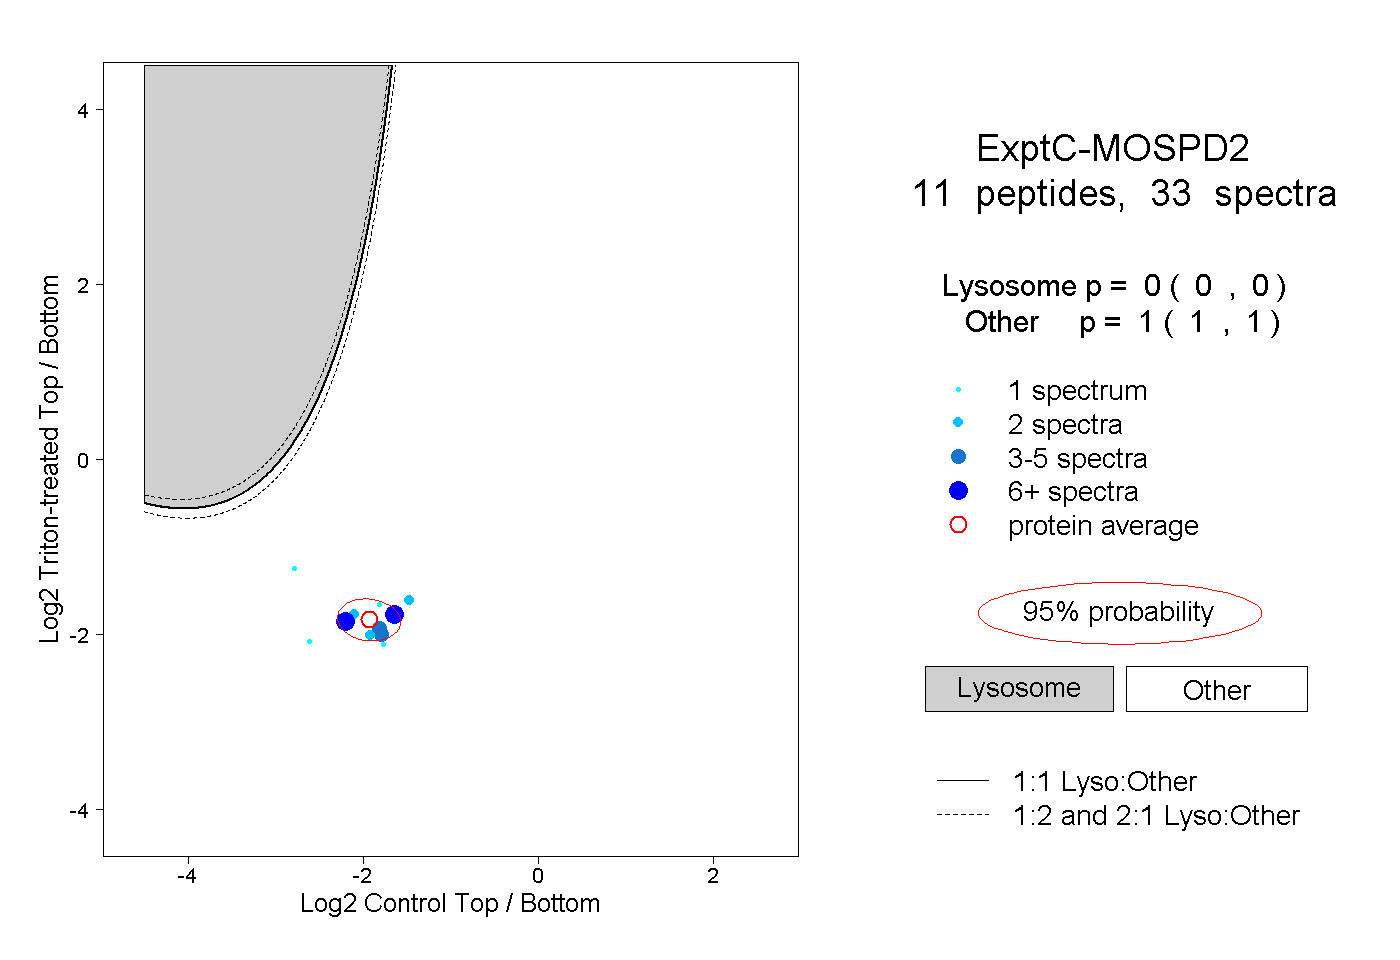
0.000 | 0.000
1.000 | 1.000
3peptides
spectra
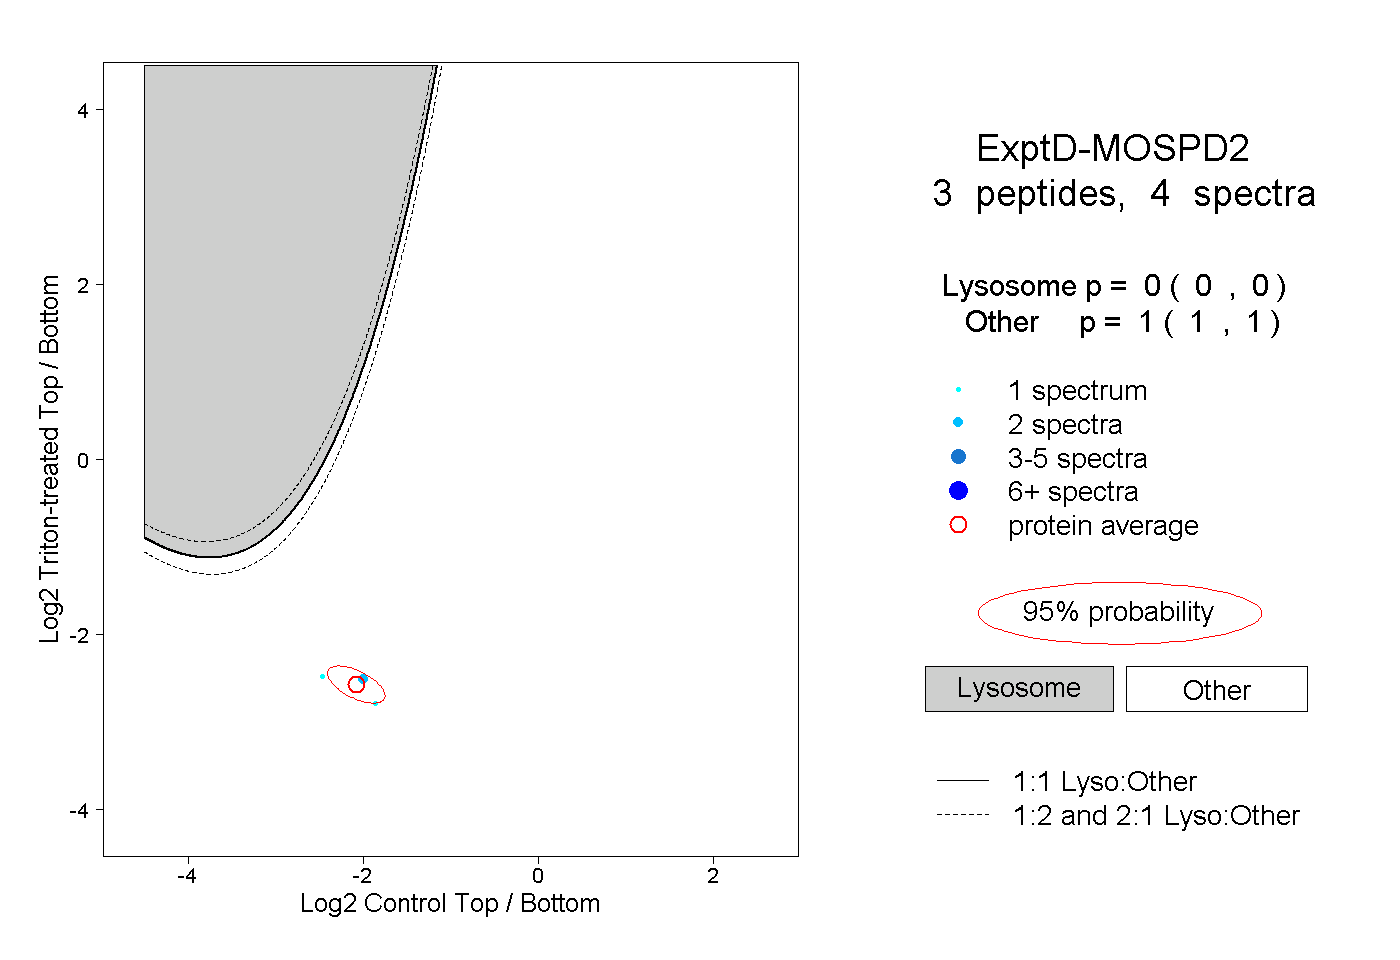
0.000 | 0.000
1.000 | 1.000