 11
11peptides
spectra
0.000 | 0.000
0.000 | 0.000
0.000 | 0.019
0.479 | 0.570
0.024 | 0.112
0.000 | 0.000
0.379 | 0.401
0.000 | 0.000
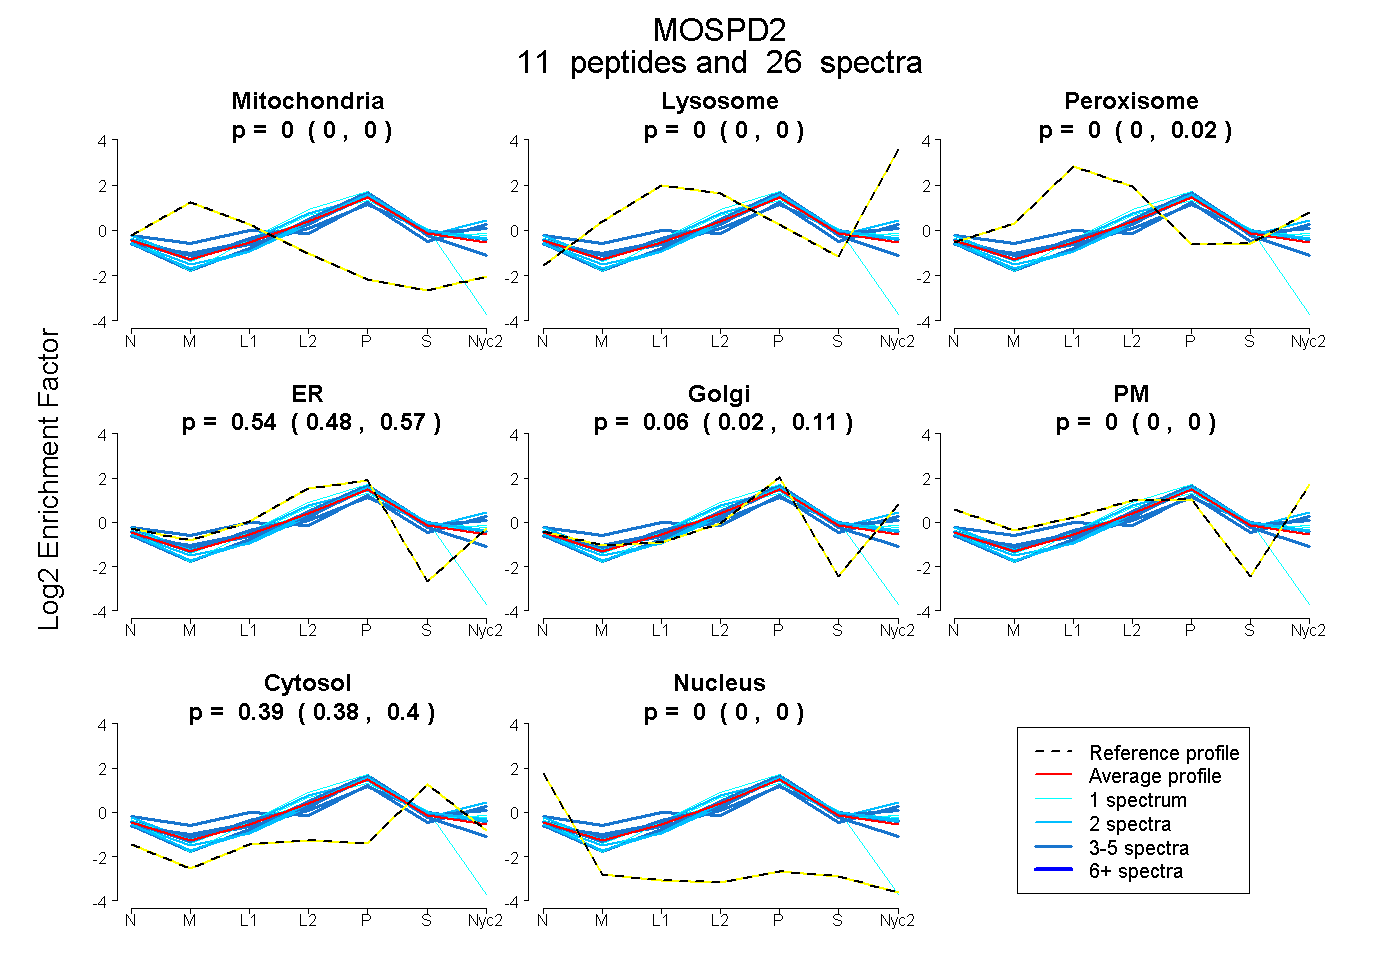
| Plot | Mito | Lyso | Perox | ER | Golgi | PM | Cytosol | Nucleus | |||||
| Expt A |
11 peptides |
26 spectra |
|
0.000 0.000 | 0.000 |
0.000 0.000 | 0.000 |
0.002 0.000 | 0.019 |
0.540 0.479 | 0.570 |
0.065 0.024 | 0.112 |
0.000 0.000 | 0.000 |
0.394 0.379 | 0.401 |
0.000 0.000 | 0.000 |
| 5 spectra, SNPTESASK | 0.000 | 0.000 | 0.000 | 0.602 | 0.000 | 0.000 | 0.398 | 0.000 | ||
| 1 spectrum, FIINCFK | 0.000 | 0.000 | 0.000 | 0.527 | 0.000 | 0.000 | 0.370 | 0.103 | ||
| 1 spectrum, ELSVNDLSESSIPR | 0.000 | 0.000 | 0.060 | 0.399 | 0.176 | 0.000 | 0.365 | 0.000 | ||
| 3 spectra, MLDESFQWR | 0.000 | 0.030 | 0.091 | 0.209 | 0.357 | 0.000 | 0.314 | 0.000 | ||
| 2 spectra, LISETR | 0.000 | 0.000 | 0.000 | 0.374 | 0.217 | 0.000 | 0.409 | 0.000 | ||
| 3 spectra, DSVSALSDK | 0.000 | 0.000 | 0.246 | 0.000 | 0.533 | 0.000 | 0.221 | 0.000 | ||
| 3 spectra, LIAFWLER | 0.000 | 0.000 | 0.000 | 0.466 | 0.134 | 0.000 | 0.401 | 0.000 | ||
| 1 spectrum, NIVAFK | 0.000 | 0.017 | 0.000 | 0.616 | 0.028 | 0.000 | 0.339 | 0.000 | ||
| 3 spectra, FEAEYVTEK | 0.000 | 0.000 | 0.057 | 0.322 | 0.207 | 0.000 | 0.414 | 0.000 | ||
| 2 spectra, HNVVDETLK | 0.000 | 0.100 | 0.000 | 0.346 | 0.142 | 0.103 | 0.309 | 0.000 | ||
| 2 spectra, SWLGPEAVSLLK | 0.000 | 0.000 | 0.000 | 0.407 | 0.179 | 0.000 | 0.414 | 0.000 |
| Plot | Mito | Lyso or Perox | ER | Golgi | PM | Cytosol | Nucleus | ||||||
| Expt B |
4 peptides |
6 spectra |
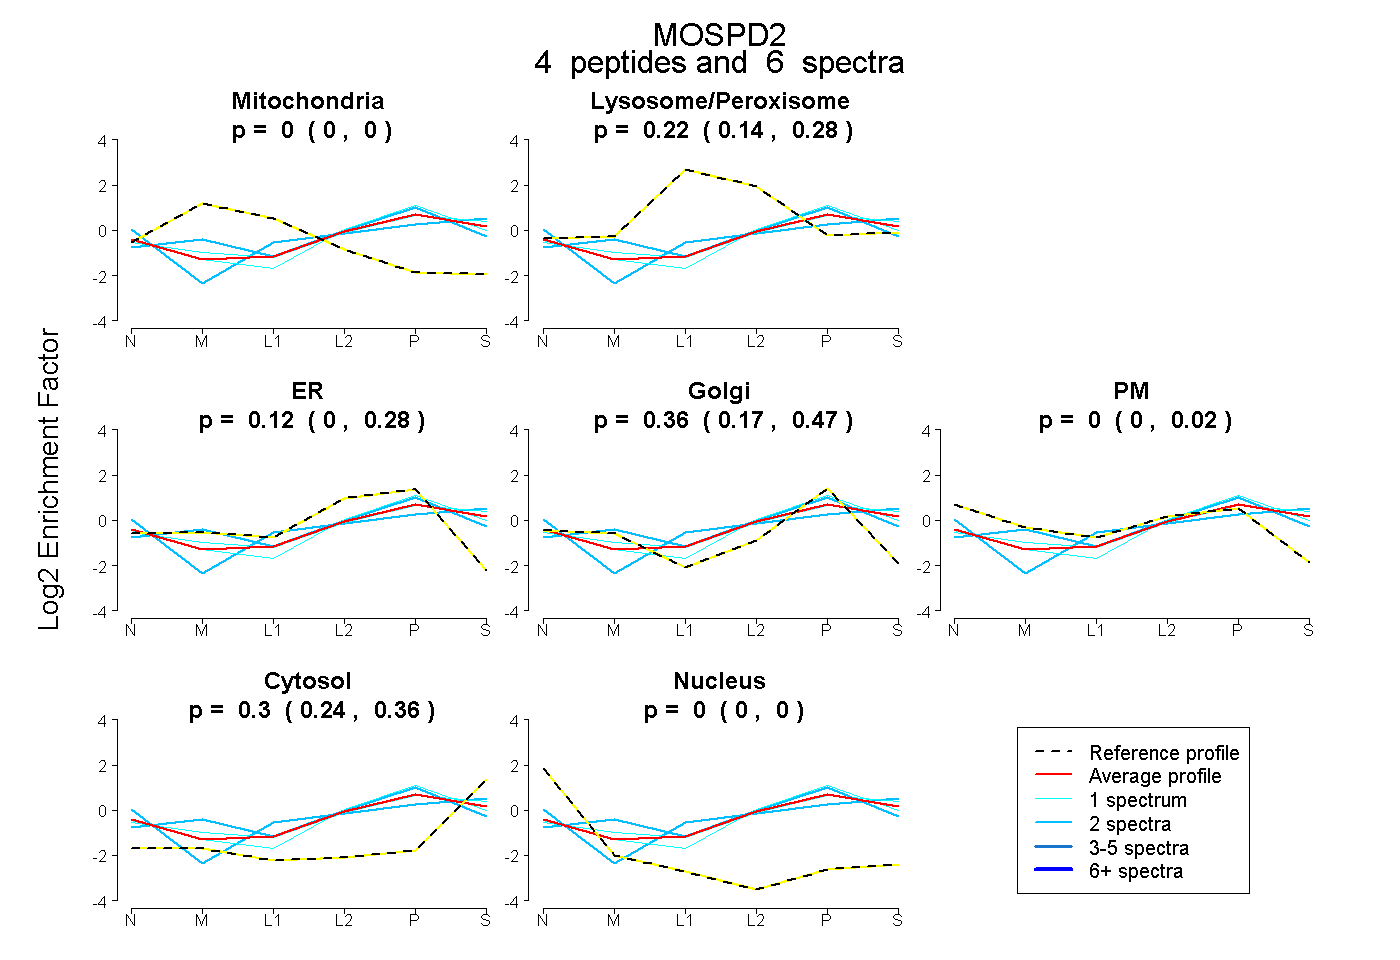 |
0.000 0.000 | 0.000 |
0.223 0.136 | 0.280 |
0.120 0.000 | 0.276 |
0.357 0.166 | 0.473 |
0.000 0.000 | 0.016 |
0.300 0.239 | 0.362 |
0.000 0.000 | 0.000 |
|||
| Plot | Lyso | Other | |||||||||||
| Expt C |
11 peptides |
33 spectra |
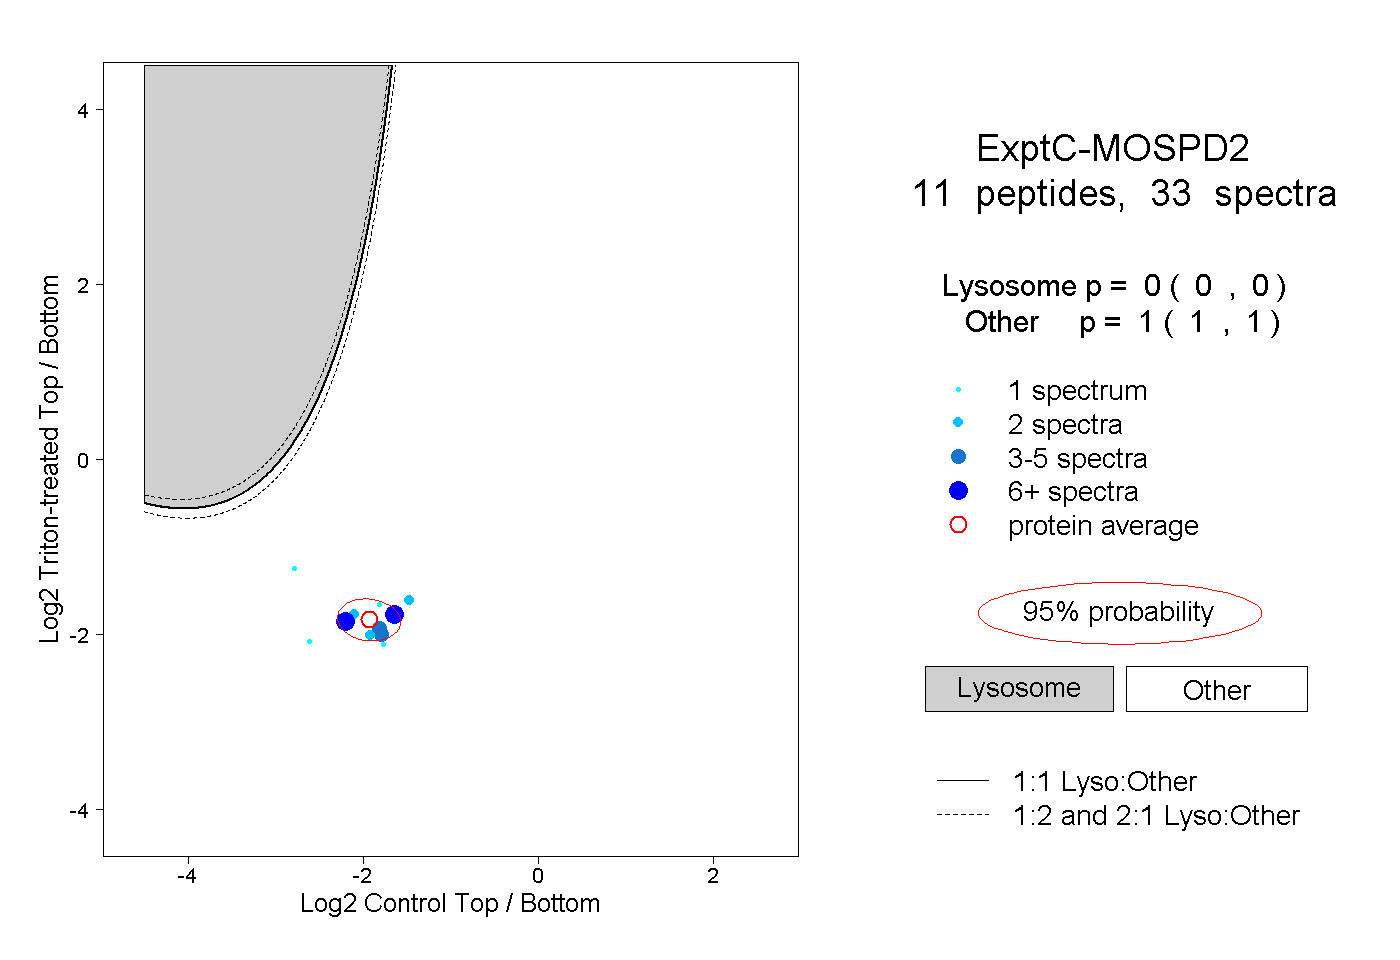 |
0.000 0.000 | 0.000 |
1.000 1.000 | 1.000 |
||||||||
| Plot | Lyso | Other | |||||||||||
| Expt D |
3 peptides |
4 spectra |
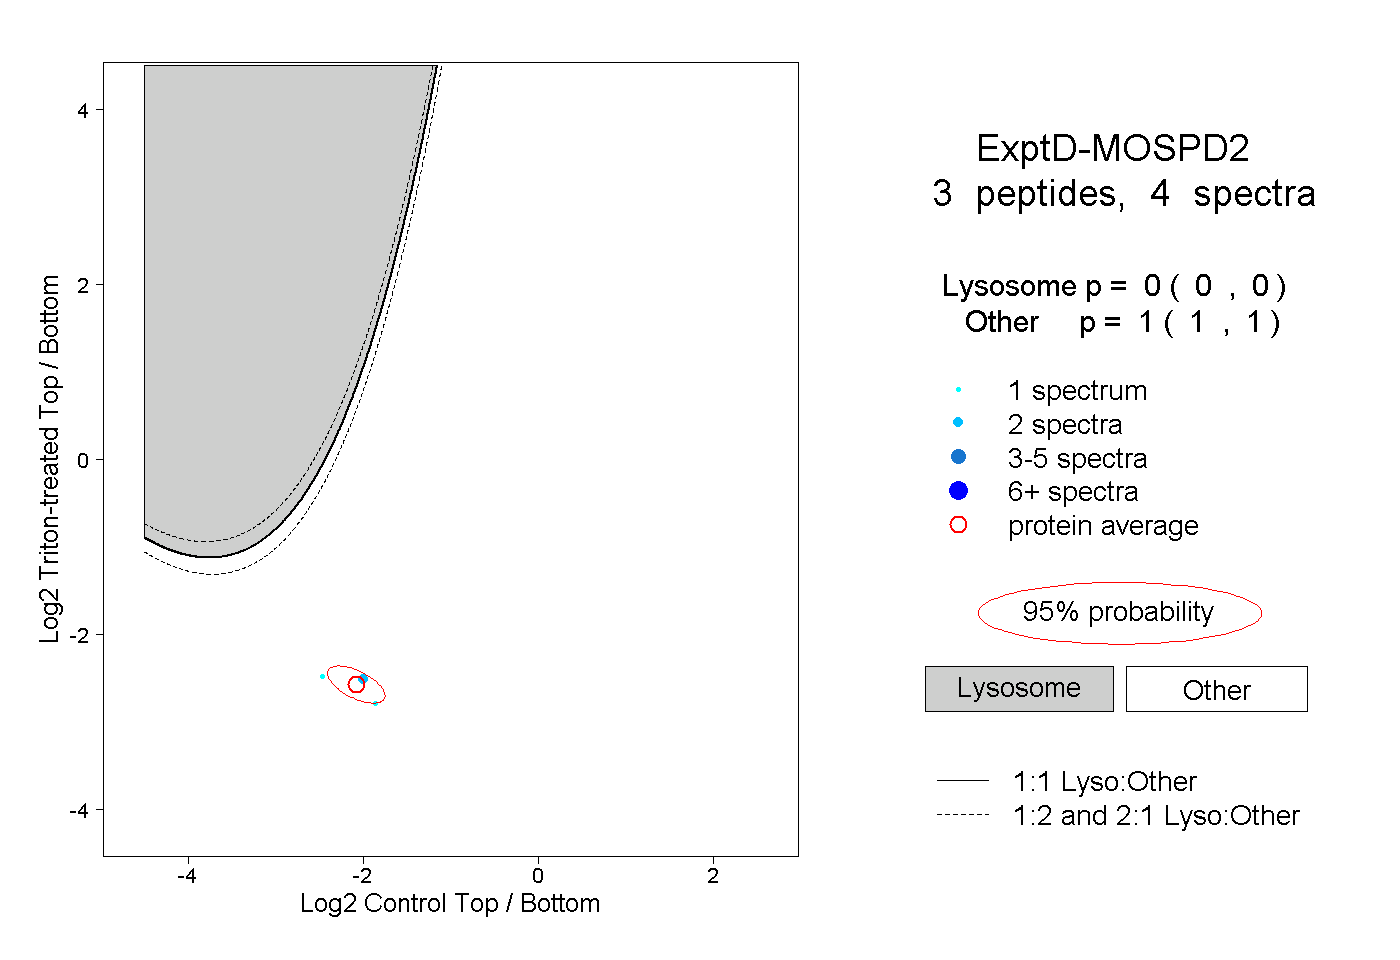 |
0.000 0.000 | 0.000 |
1.000 1.000 | 1.000 |