 3
3peptides
spectra
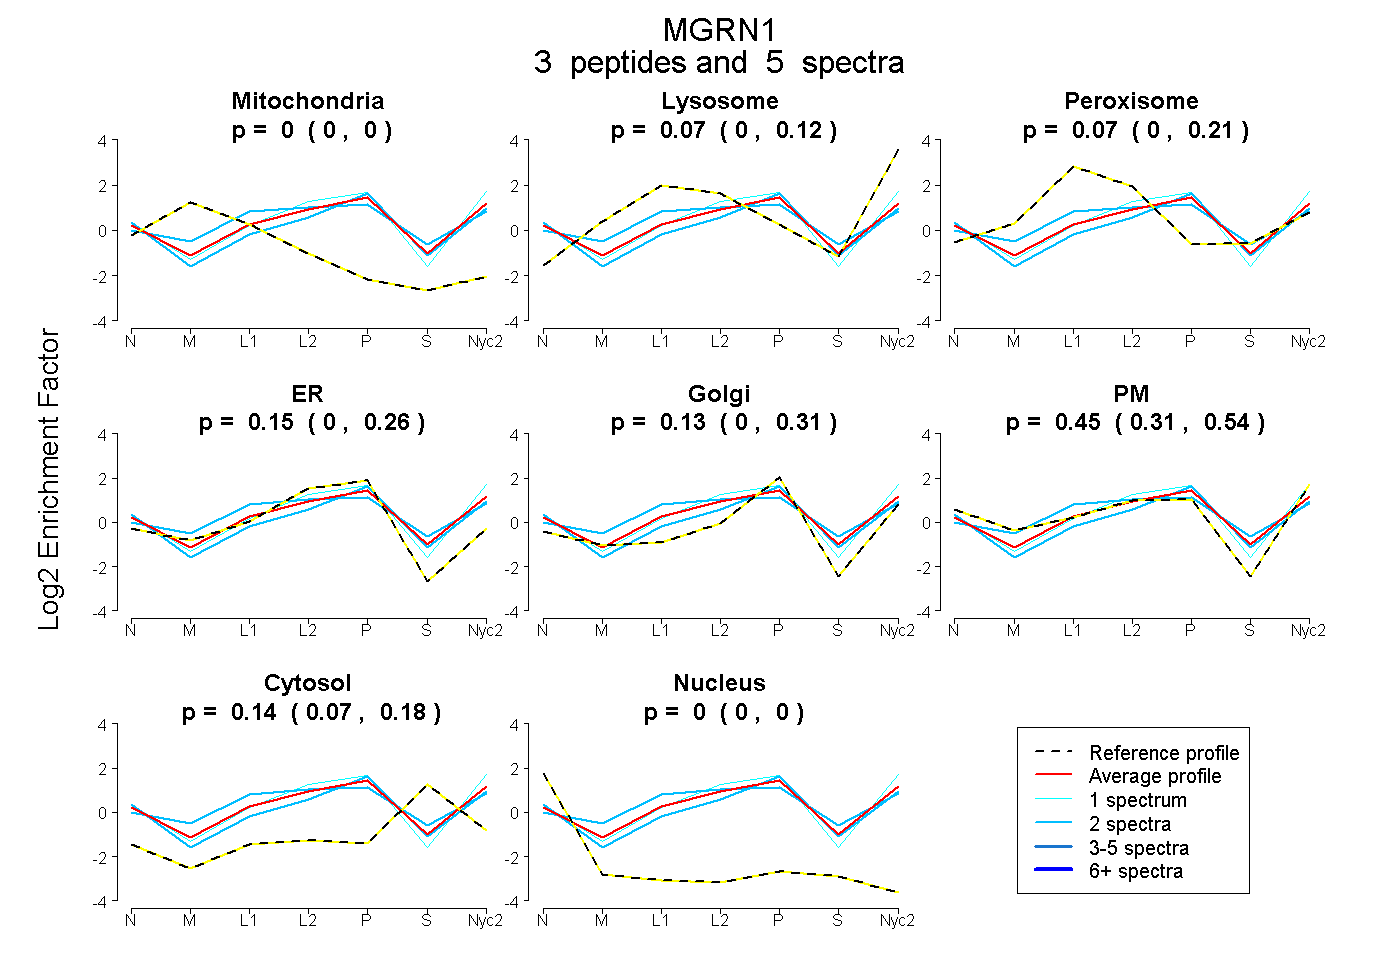
0.000 | 0.000
0.000 | 0.123
0.000 | 0.207
0.000 | 0.256
0.000 | 0.314
0.308 | 0.540
0.069 | 0.182
0.000 | 0.000
1peptide
spectra
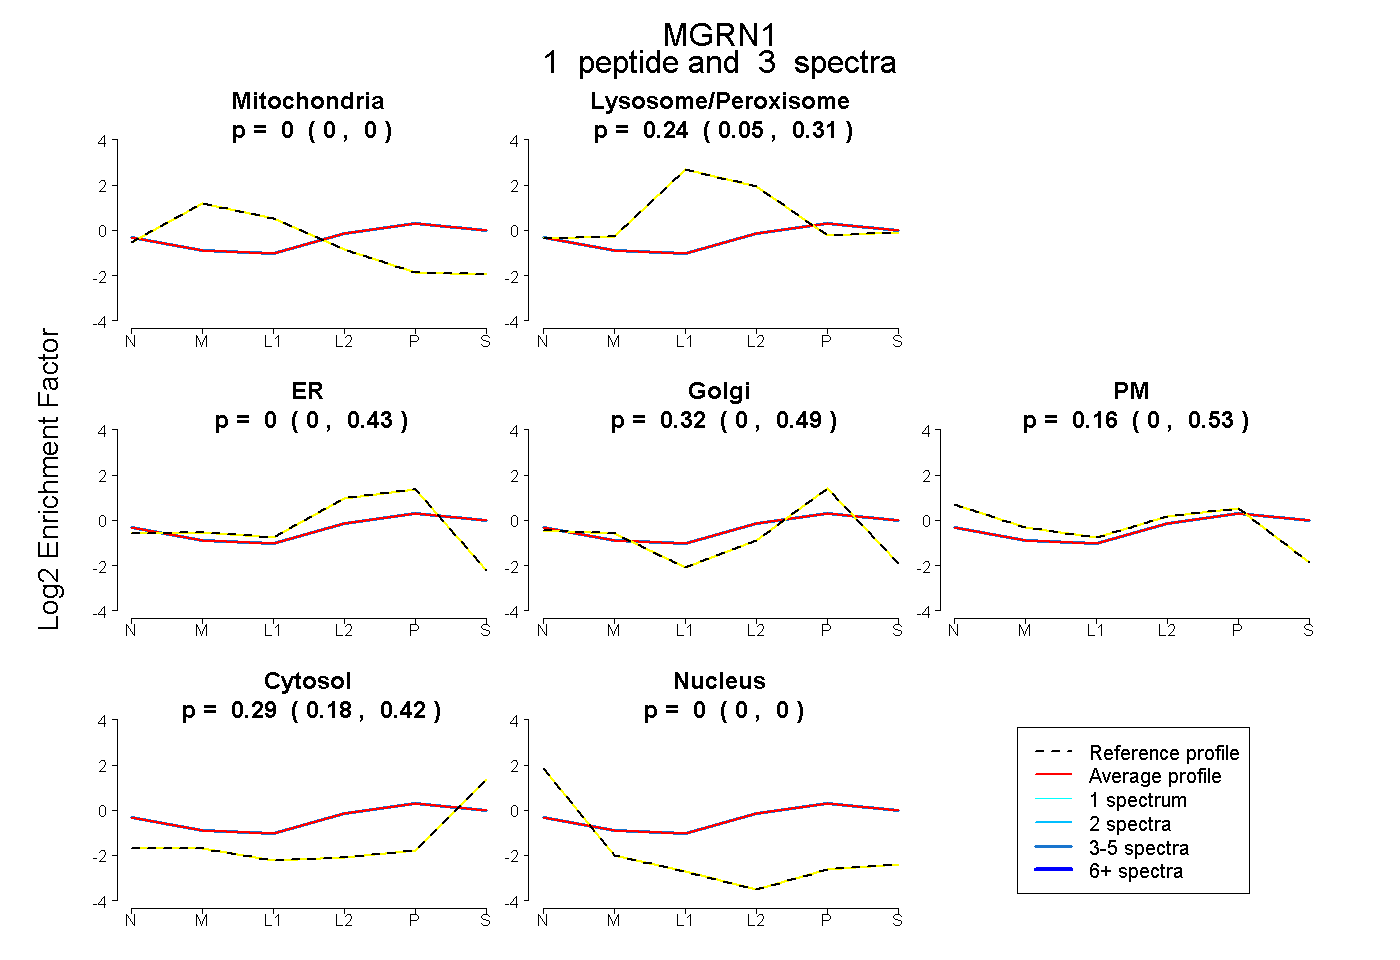
0.000 | 0.000
0.048 | 0.306
0.000 | 0.429
0.000 | 0.486
0.000 | 0.526
0.179 | 0.423
0.000 | 0.000
1peptide
spectra
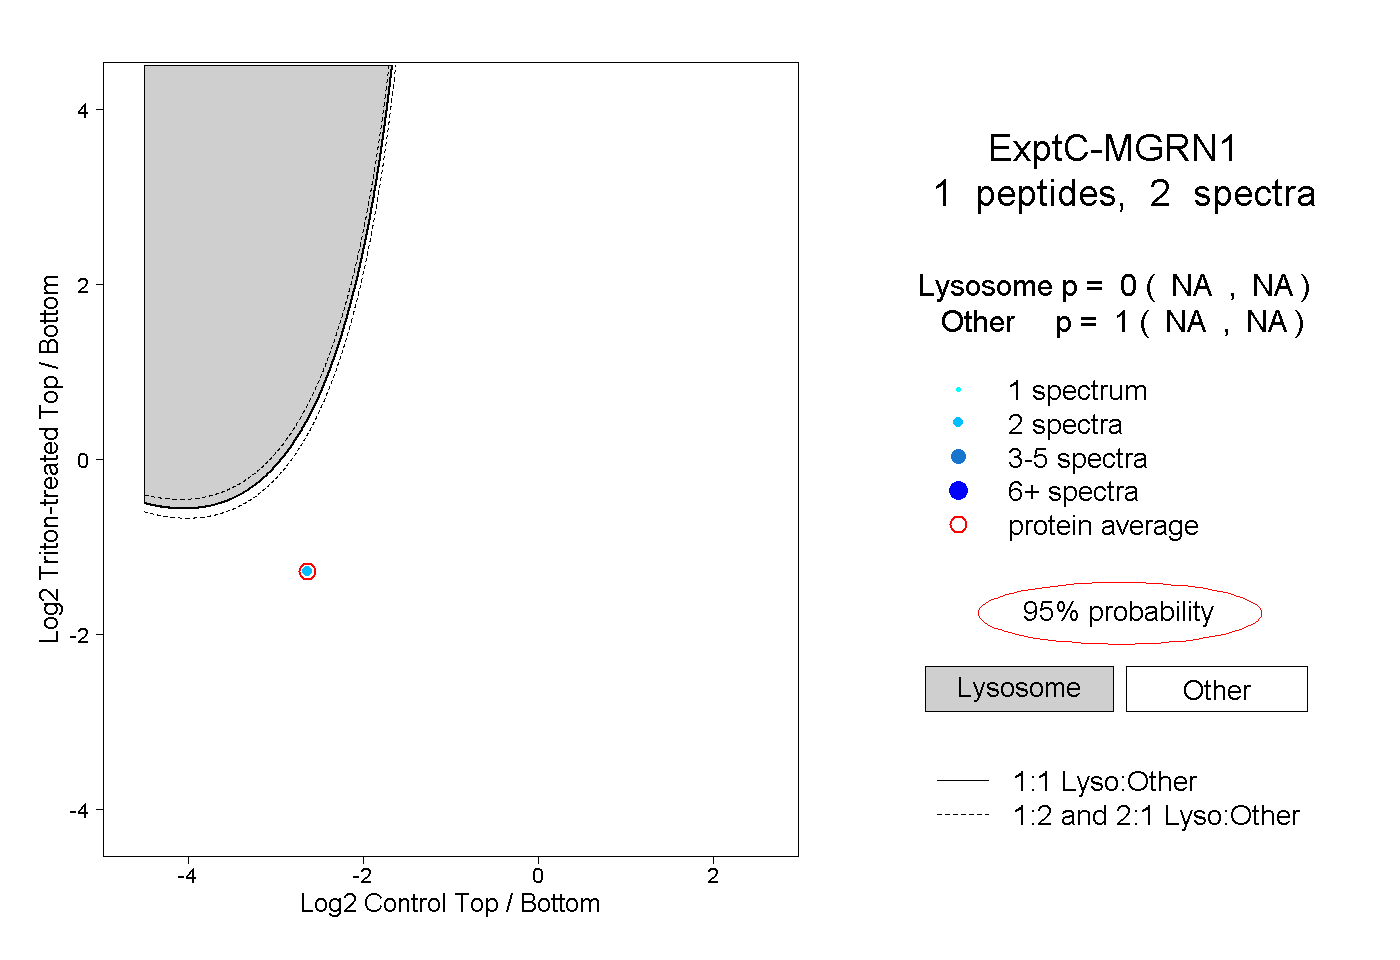
NA | NA
NA | NA