 3
3peptides
spectra
0.000 | 0.000
0.000 | 0.123
0.000 | 0.207
0.000 | 0.256
0.000 | 0.314
0.308 | 0.540
0.069 | 0.182
0.000 | 0.000
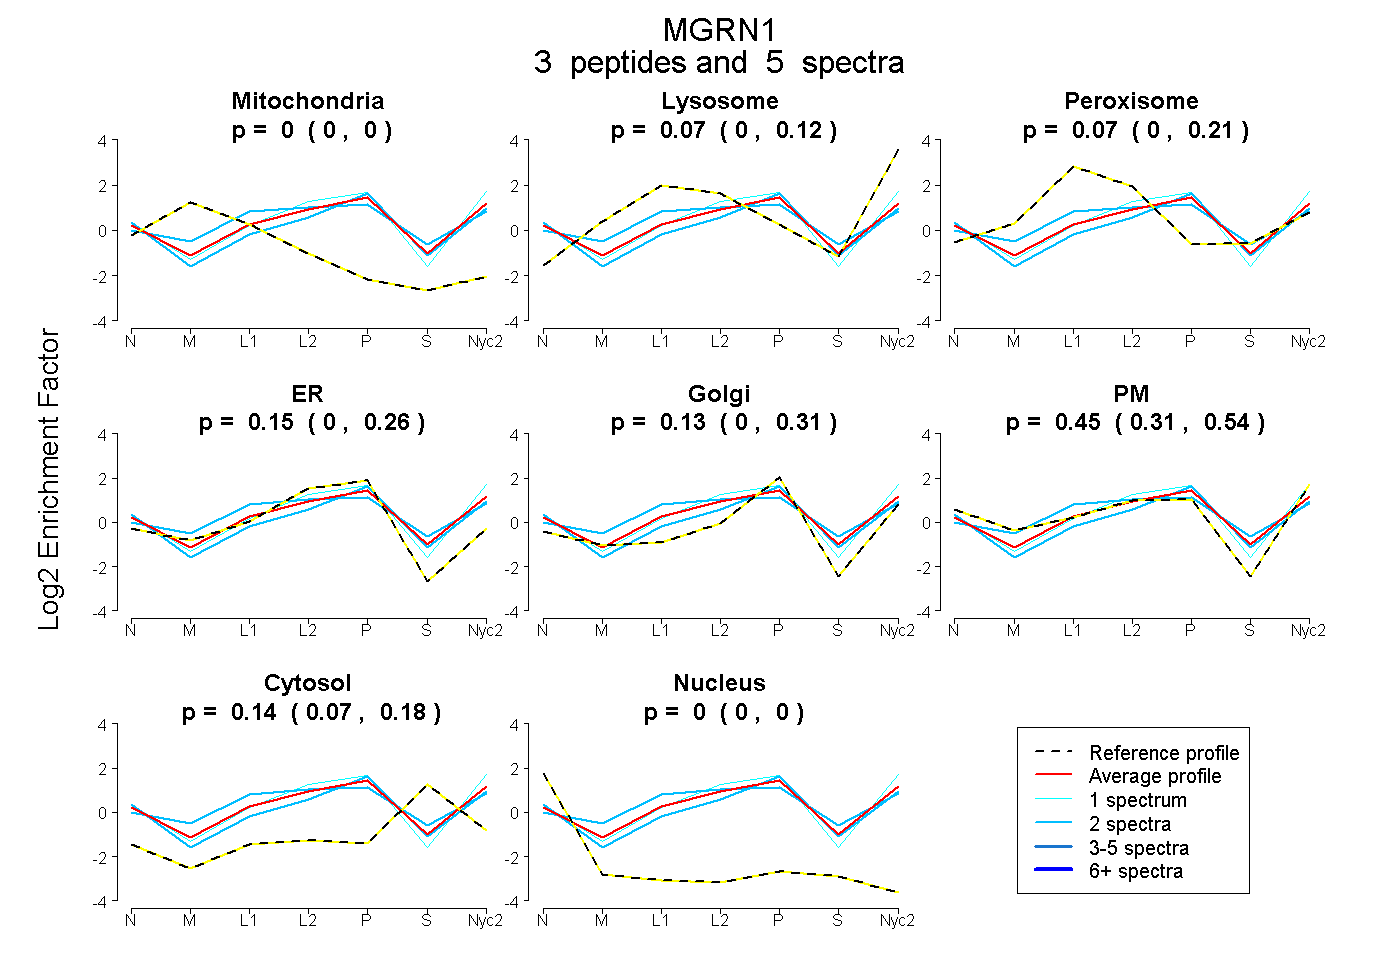
| Plot | Mito | Lyso | Perox | ER | Golgi | PM | Cytosol | Nucleus | |||||
| Expt A |
3 peptides |
5 spectra |
|
0.000 0.000 | 0.000 |
0.066 0.000 | 0.123 |
0.072 0.000 | 0.207 |
0.150 0.000 | 0.256 |
0.127 0.000 | 0.314 |
0.445 0.308 | 0.540 |
0.139 0.069 | 0.182 |
0.000 0.000 | 0.000 |
| 2 spectra, DTLILPCR | 0.000 | 0.000 | 0.442 | 0.007 | 0.378 | 0.106 | 0.069 | 0.000 | ||
| 2 spectra, SLVNIR | 0.000 | 0.000 | 0.000 | 0.116 | 0.256 | 0.446 | 0.182 | 0.000 | ||
| 1 spectrum, ALLQIR | 0.000 | 0.103 | 0.000 | 0.120 | 0.146 | 0.587 | 0.044 | 0.000 |
| Plot | Mito | Lyso or Perox | ER | Golgi | PM | Cytosol | Nucleus | ||||||
| Expt B |
1 peptide |
3 spectra |
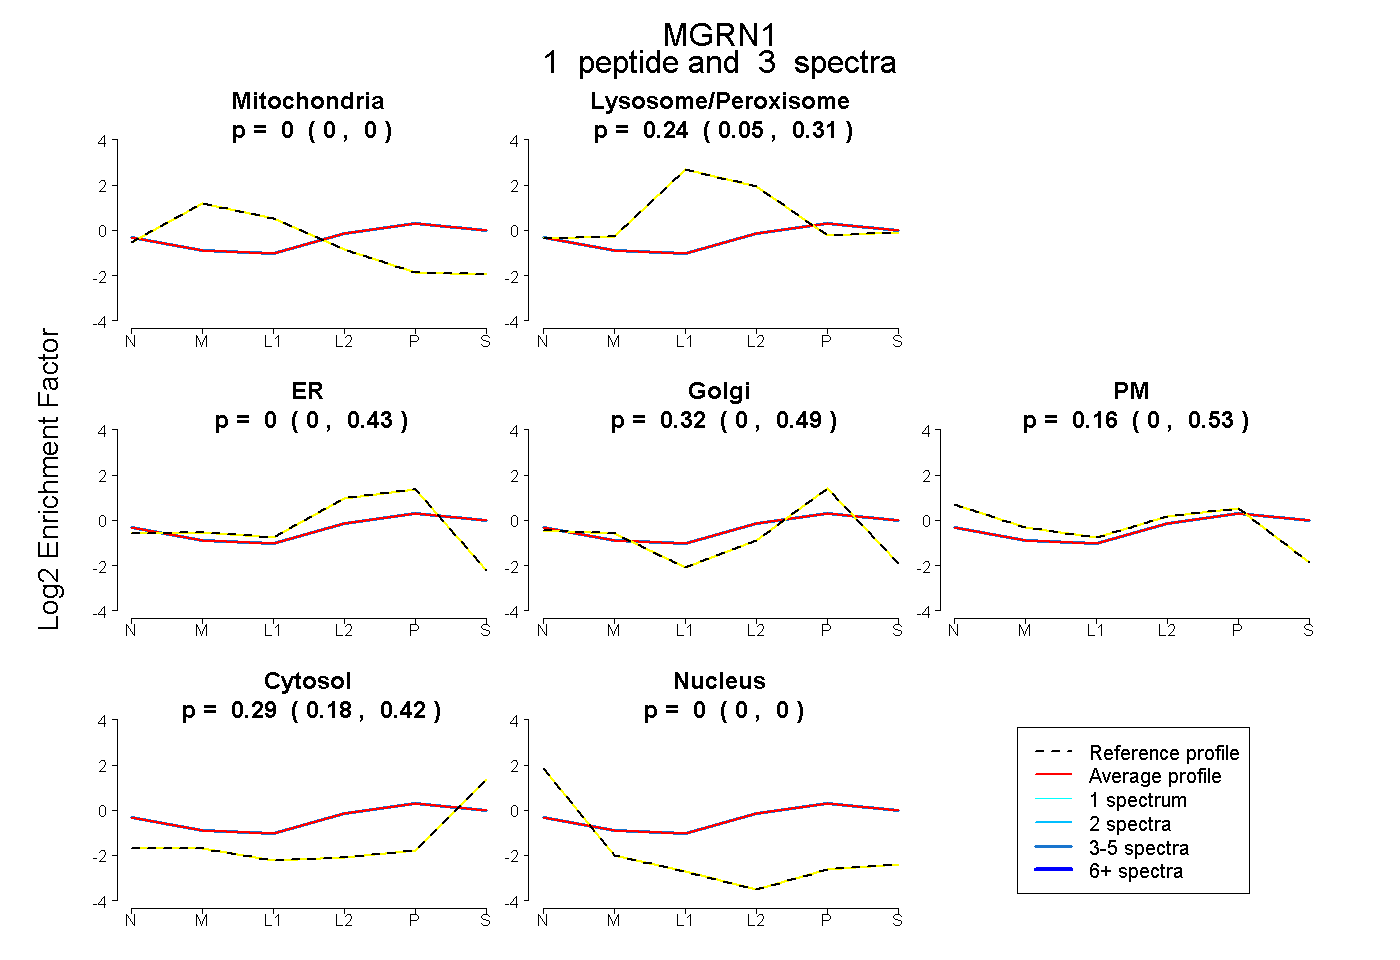 |
0.000 0.000 | 0.000 |
0.238 0.048 | 0.306 |
0.000 0.000 | 0.429 |
0.315 0.000 | 0.486 |
0.158 0.000 | 0.526 |
0.289 0.179 | 0.423 |
0.000 0.000 | 0.000 |
|||
| Plot | Lyso | Other | |||||||||||
| Expt C |
1 peptide |
2 spectra |
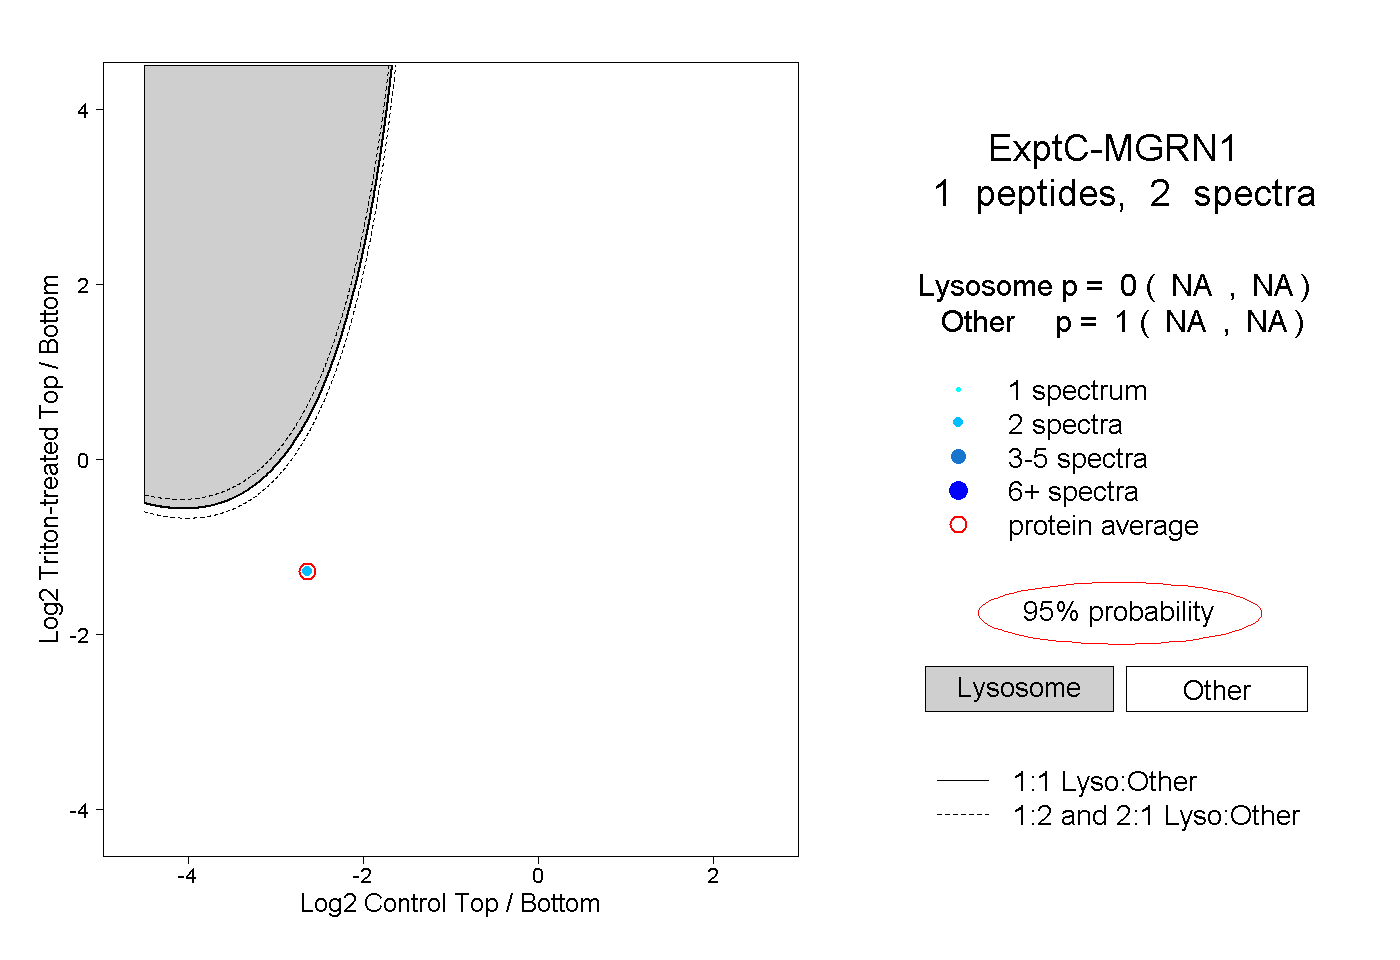 |
0.000 NA | NA |
1.000 NA | NA |