 2
2peptides
spectra
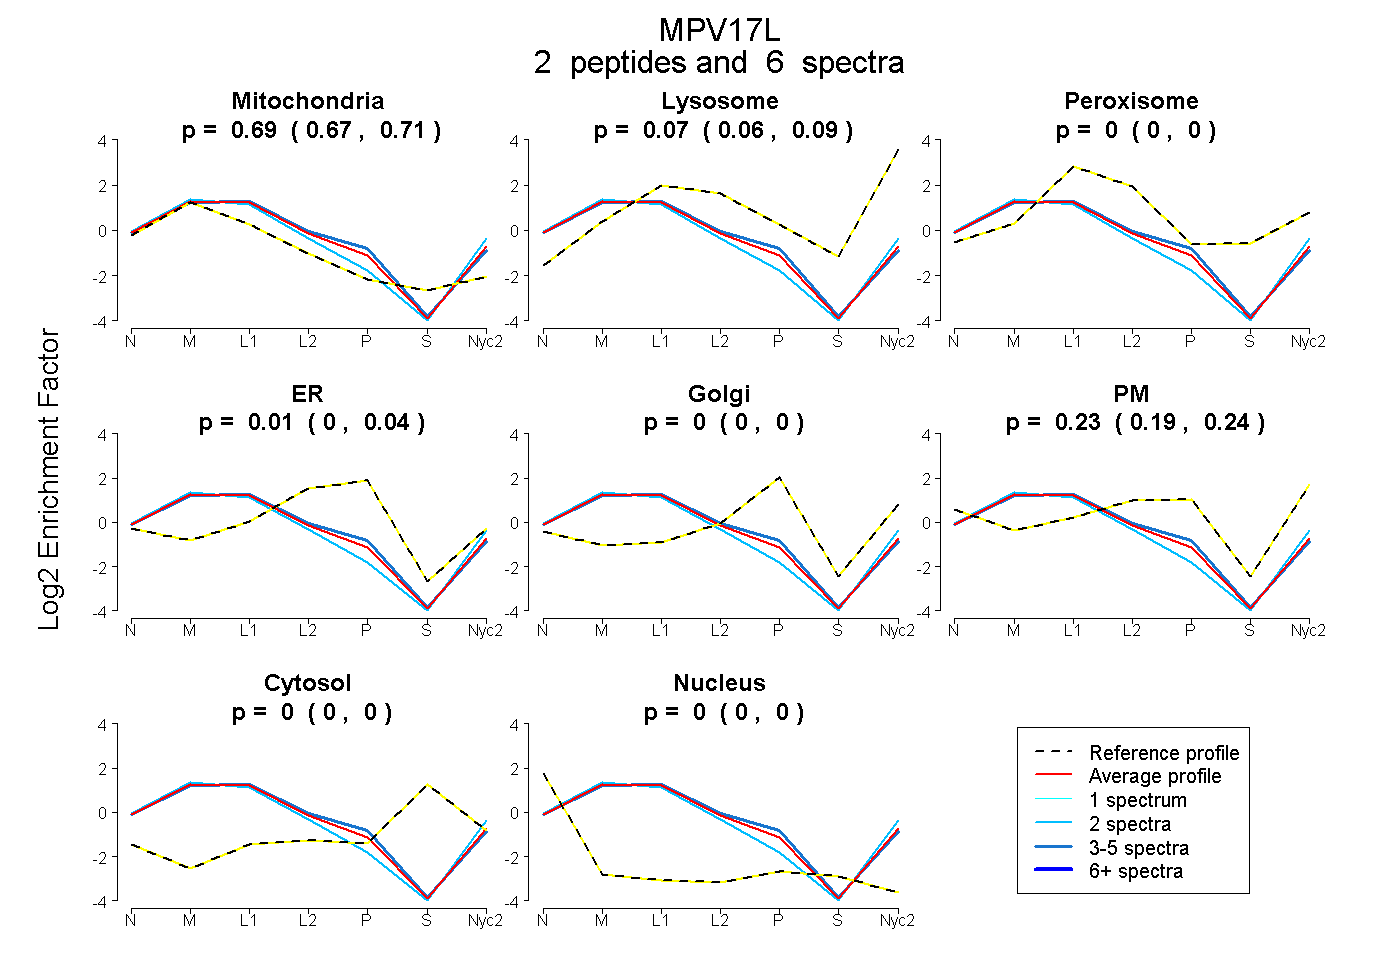
0.670 | 0.712
0.061 | 0.087
0.000 | 0.000
0.000 | 0.044
0.000 | 0.000
0.191 | 0.239
0.000 | 0.000
0.000 | 0.000
1peptide
spectrum
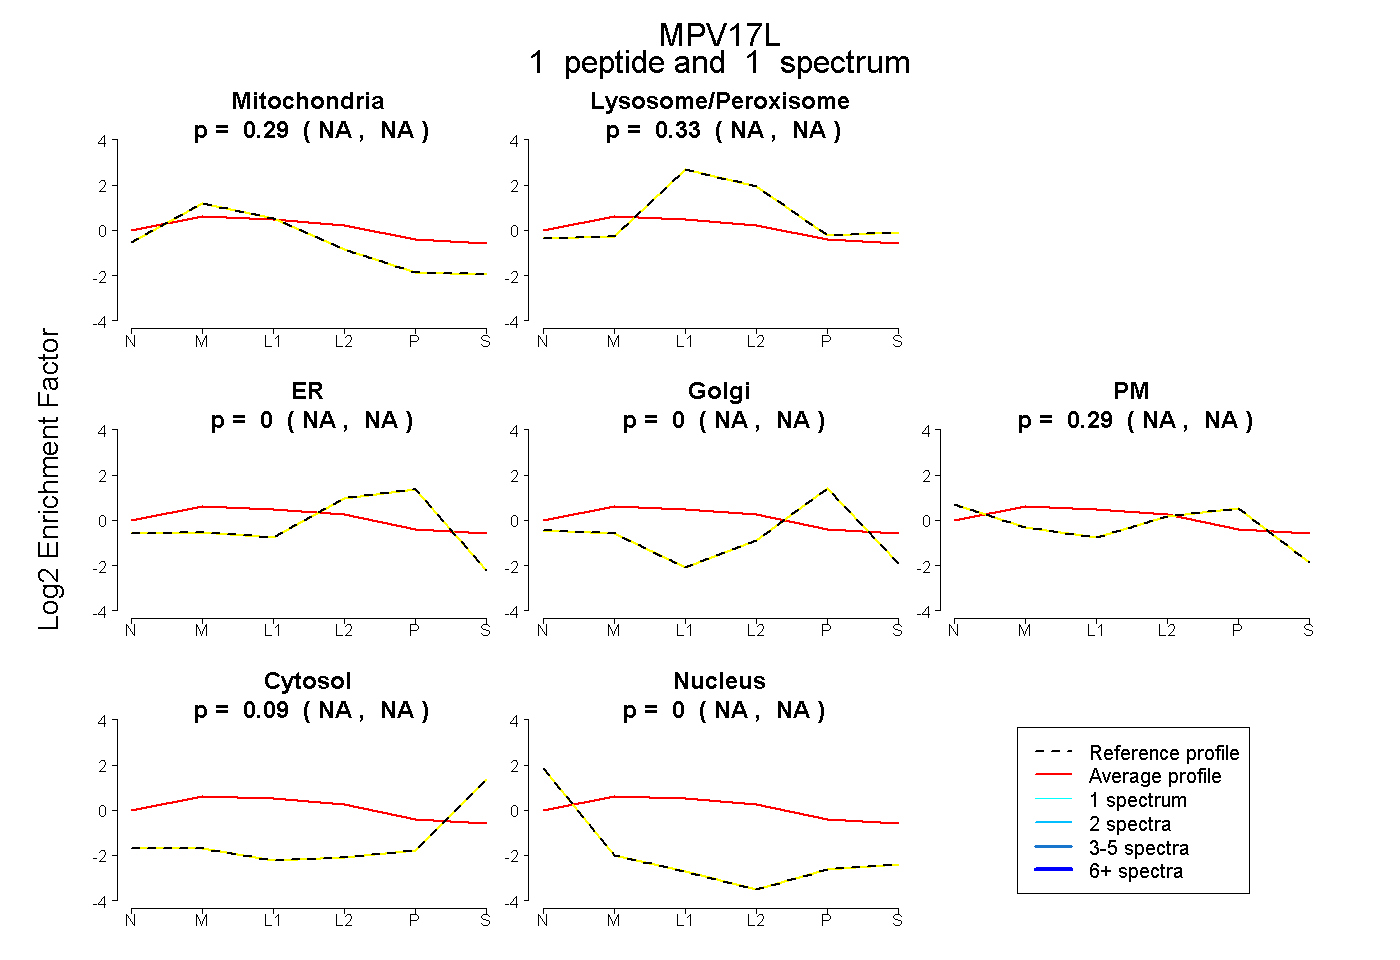
NA | NA
NA | NA
NA | NA
NA | NA
NA | NA
NA | NA
NA | NA
4peptides
spectra
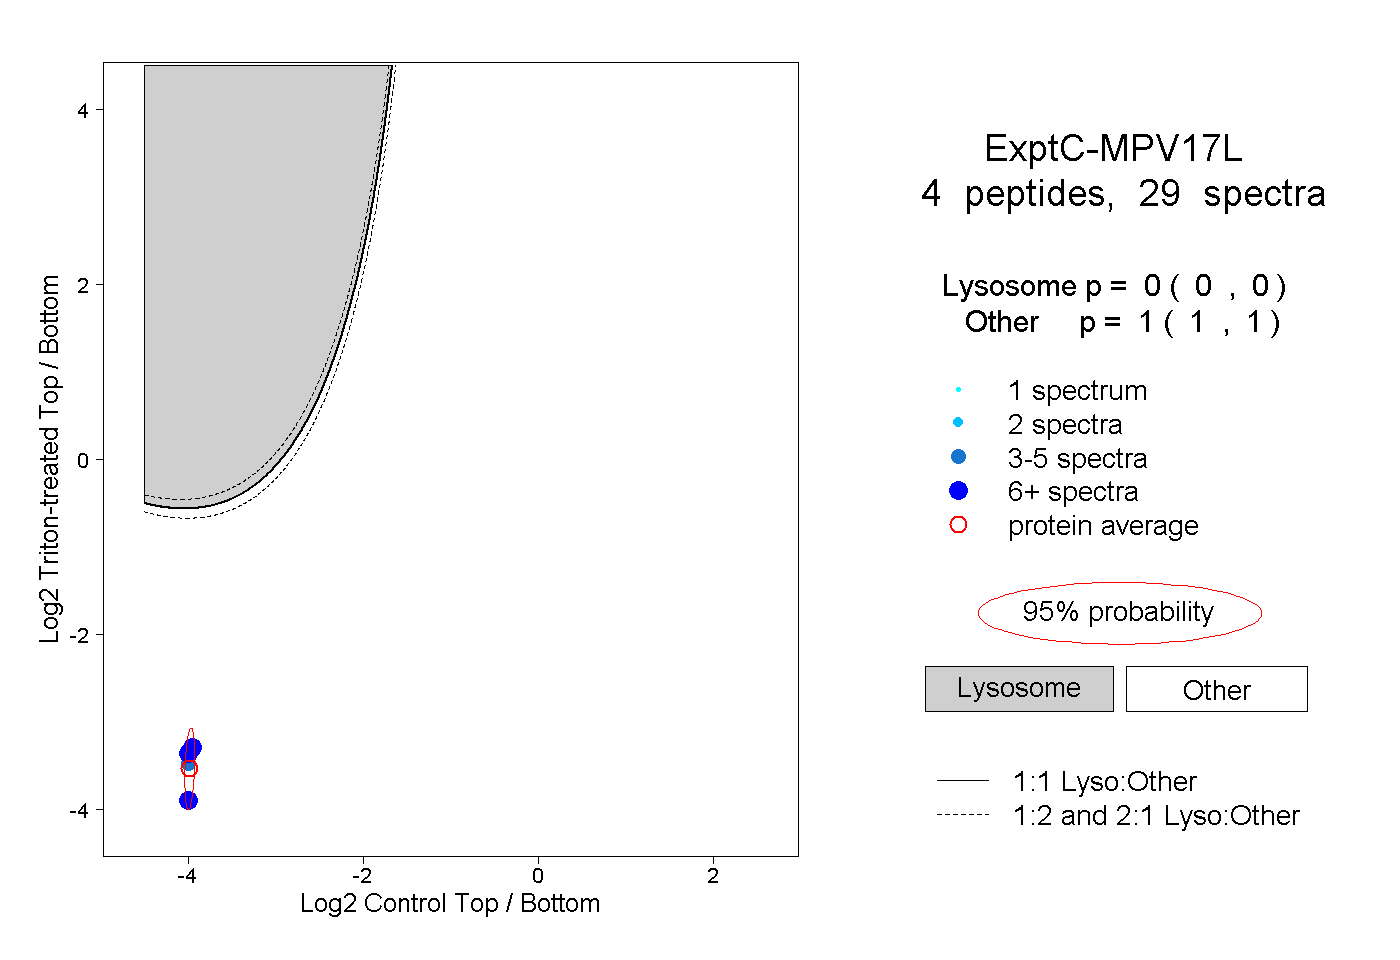
0.000 | 0.000
1.000 | 1.000