 2
2peptides
spectra
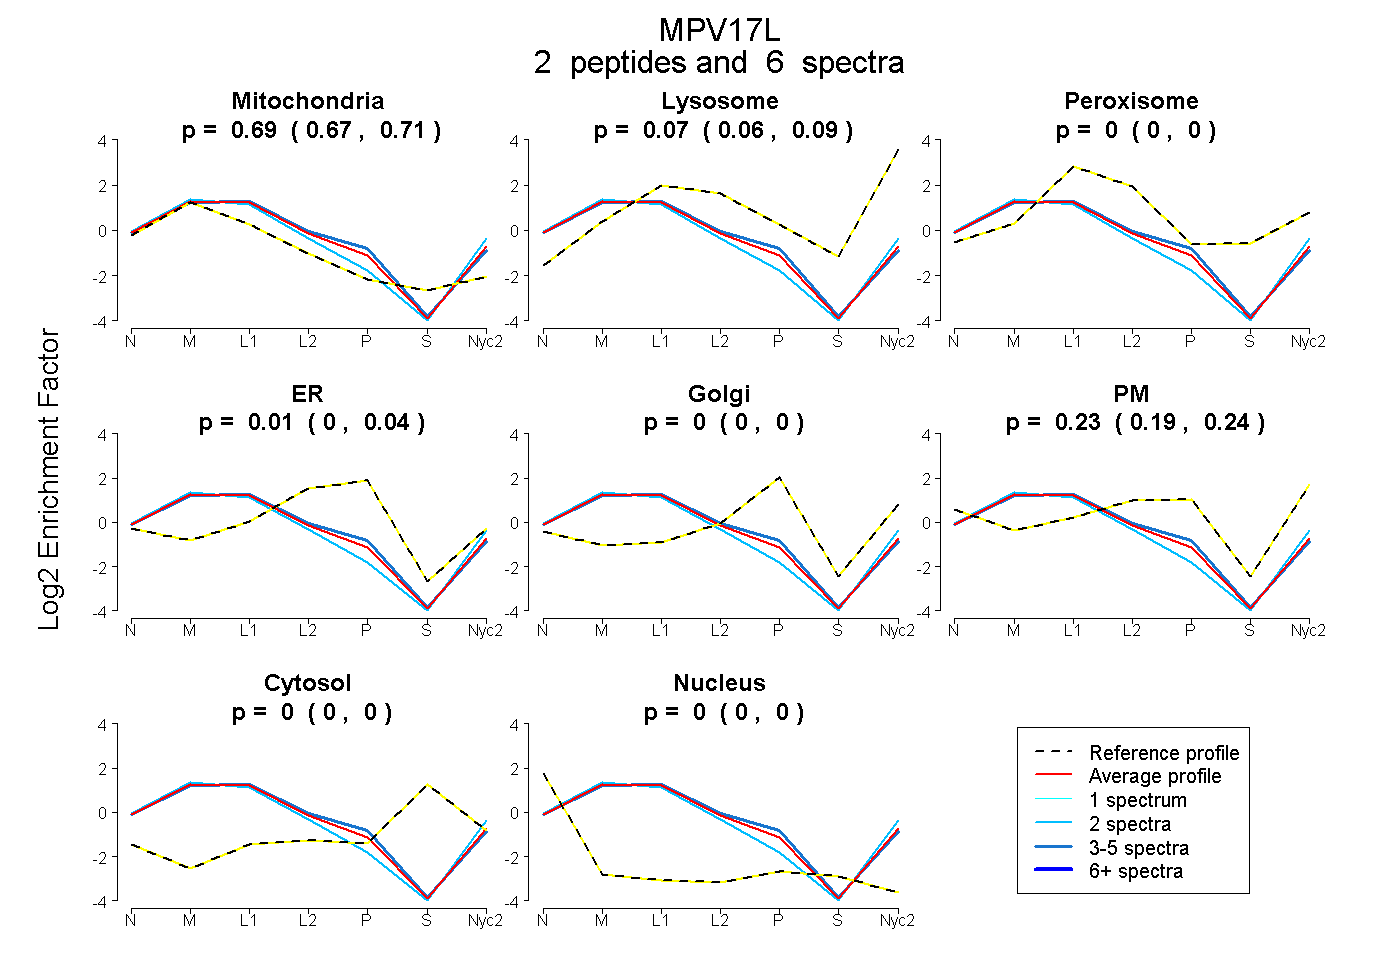
0.670 | 0.712
0.061 | 0.087
0.000 | 0.000
0.000 | 0.044
0.000 | 0.000
0.191 | 0.239
0.000 | 0.000
0.000 | 0.000
| Plot | Mito | Lyso | Perox | ER | Golgi | PM | Cytosol | Nucleus | |||||
| Expt A |
2 peptides |
6 spectra |
|
0.693 0.670 | 0.712 |
0.074 0.061 | 0.087 |
0.000 0.000 | 0.000 |
0.007 0.000 | 0.044 |
0.000 0.000 | 0.000 |
0.225 0.191 | 0.239 |
0.000 0.000 | 0.000 |
0.000 0.000 | 0.000 |
| 4 spectra, ANWWR | 0.656 | 0.069 | 0.000 | 0.143 | 0.000 | 0.131 | 0.000 | 0.000 | ||
| 2 spectra, DDIFLDLR | 0.743 | 0.133 | 0.000 | 0.000 | 0.000 | 0.124 | 0.000 | 0.000 |
| Plot | Mito | Lyso or Perox | ER | Golgi | PM | Cytosol | Nucleus | ||||||
| Expt B |
1 peptide |
1 spectrum |
 |
0.291 NA | NA |
0.328 NA | NA |
0.000 NA | NA |
0.000 NA | NA |
0.295 NA | NA |
0.086 NA | NA |
0.000 NA | NA |
|||
| Plot | Lyso | Other | |||||||||||
| Expt C |
4 peptides |
29 spectra |
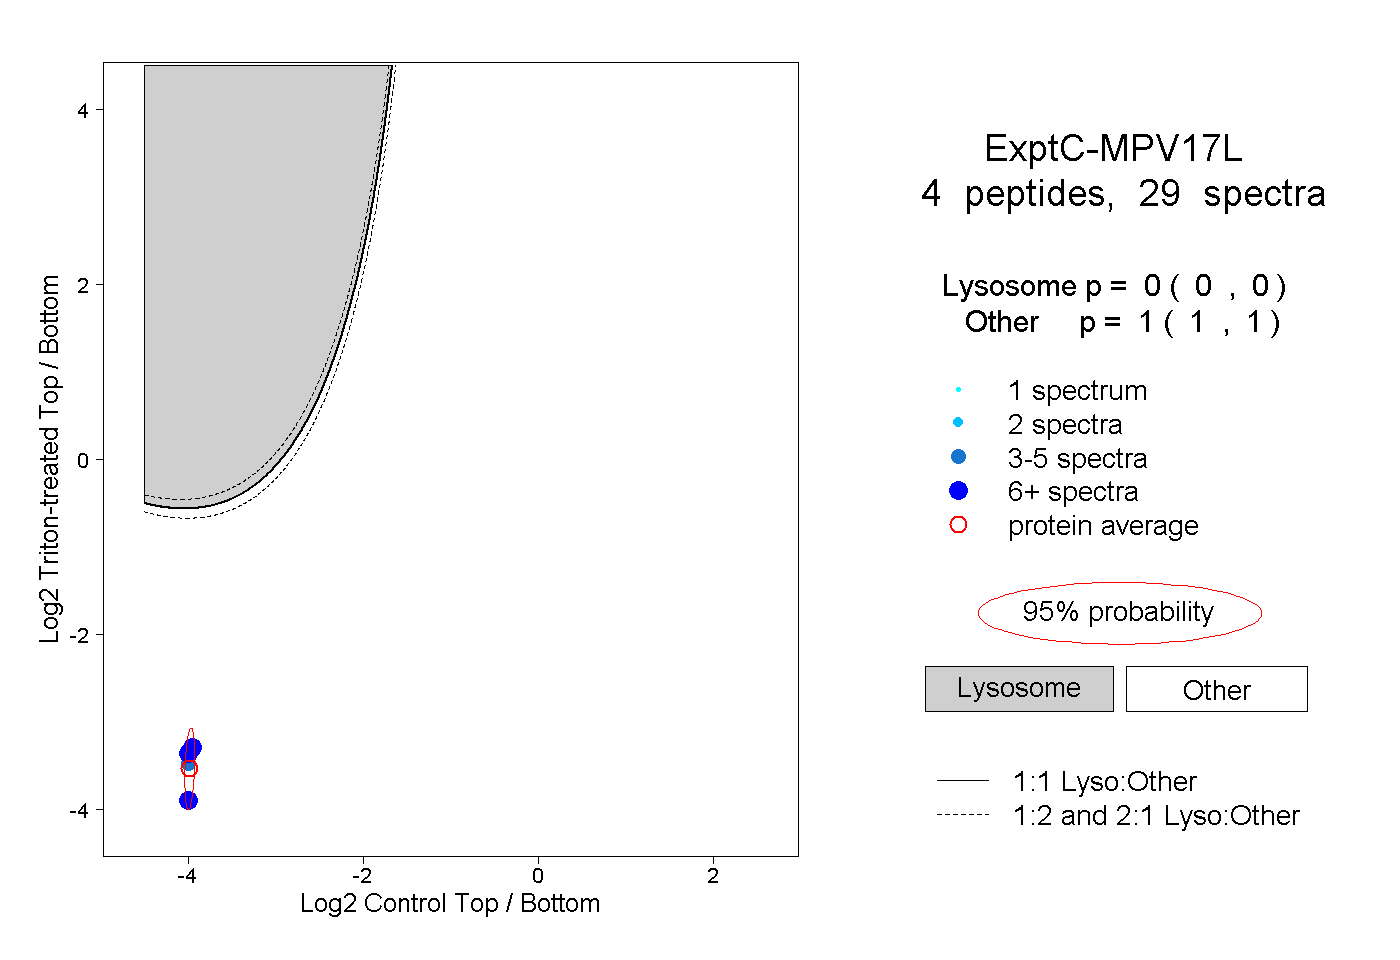 |
0.000 0.000 | 0.000 |
1.000 1.000 | 1.000 |