 16
16peptides
spectra
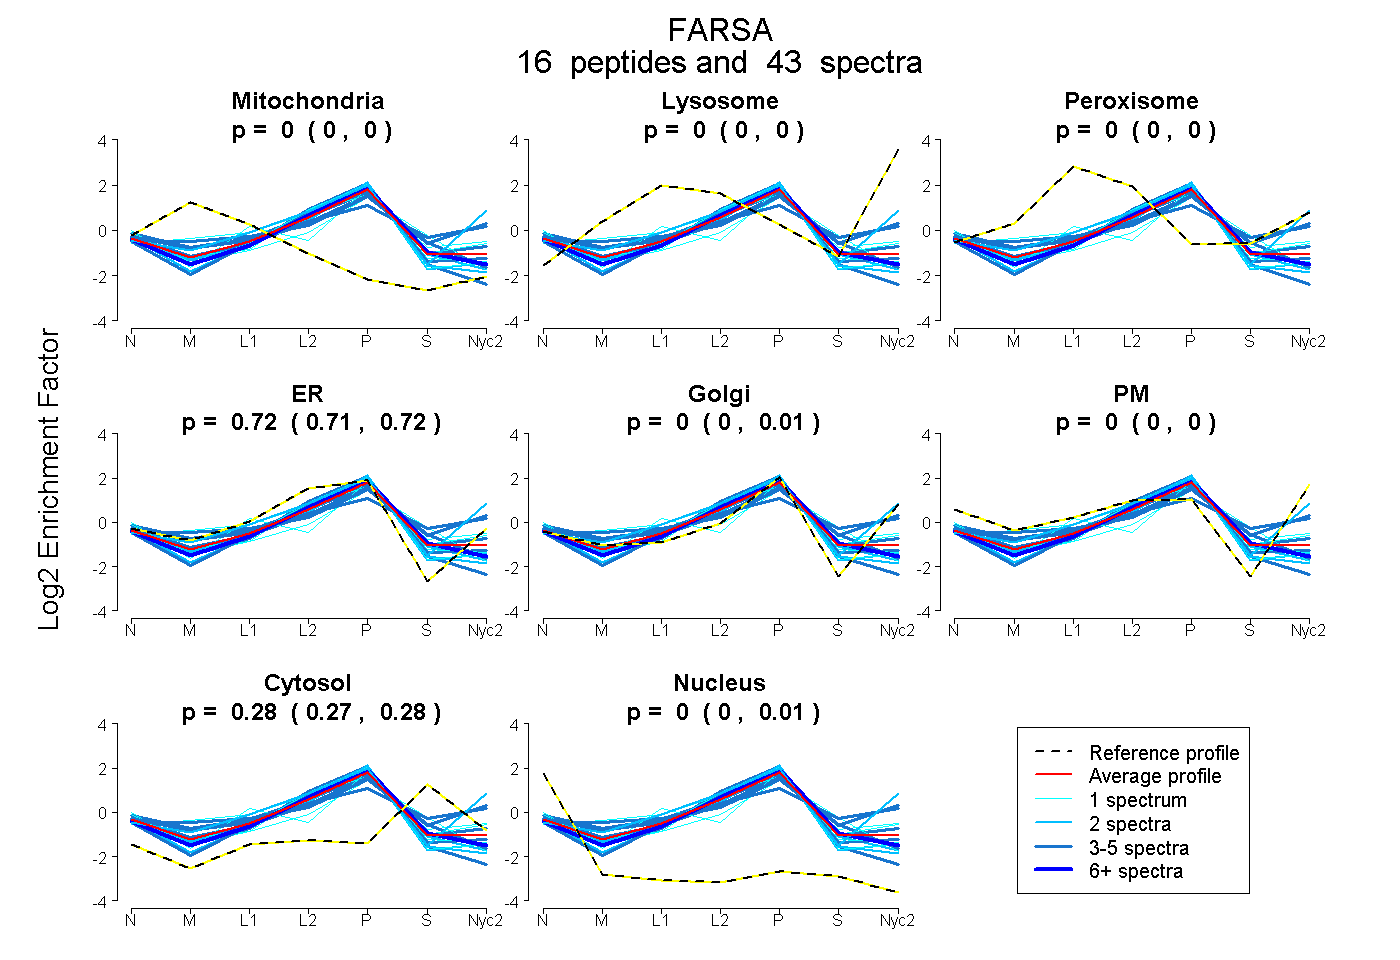
0.000 | 0.000
0.000 | 0.000
0.000 | 0.000
0.711 | 0.725
0.000 | 0.010
0.000 | 0.000
0.271 | 0.281
0.000 | 0.005
8peptides
spectra
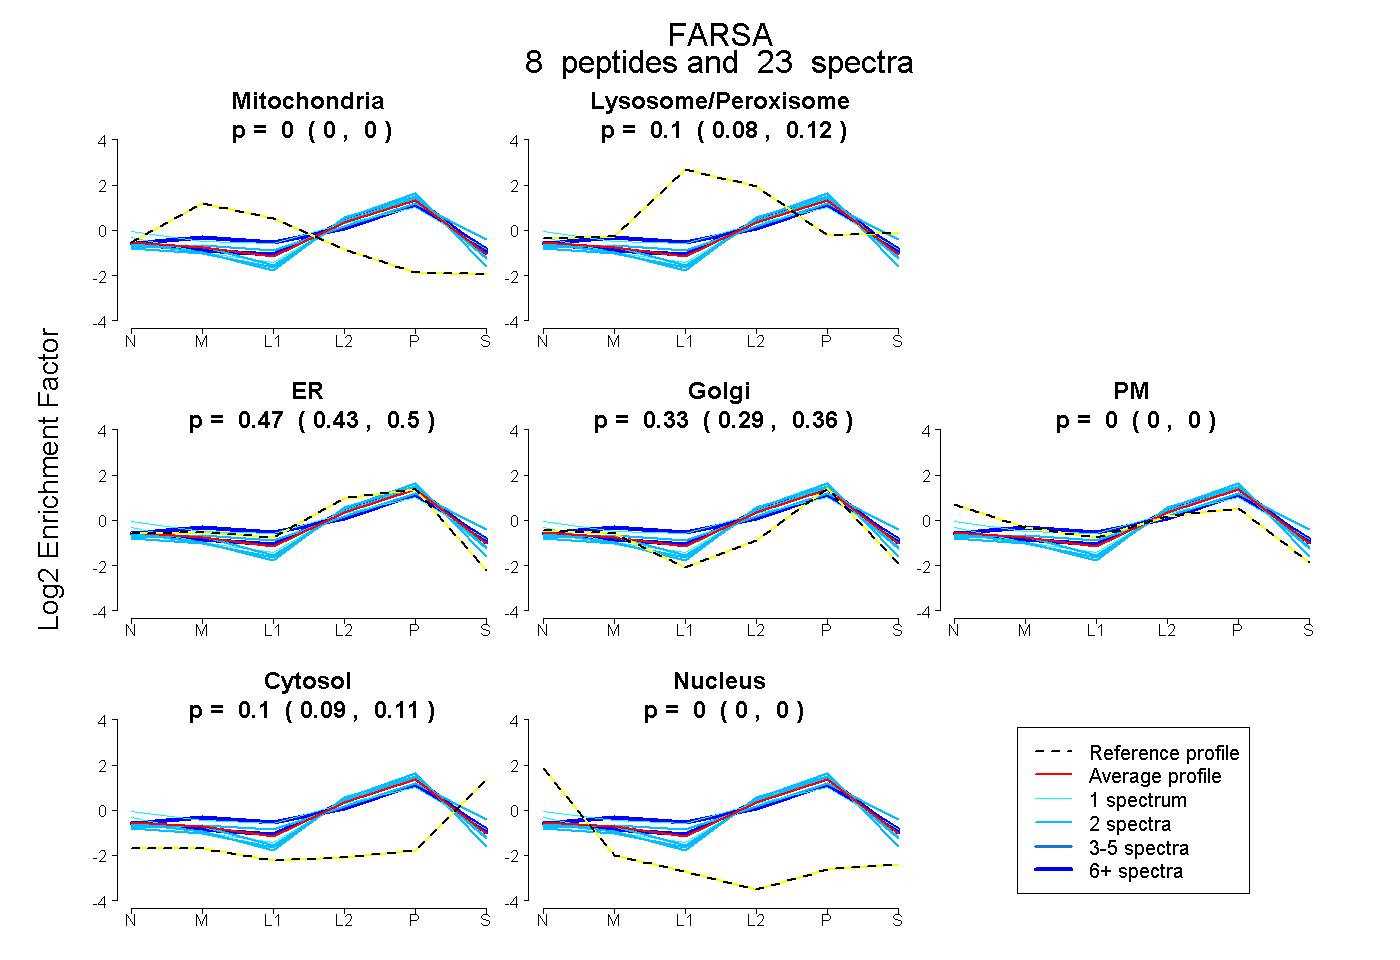
0.000 | 0.000
0.079 | 0.119
0.425 | 0.505
0.293 | 0.355
0.000 | 0.000
0.089 | 0.113
0.000 | 0.000
12peptides
spectra
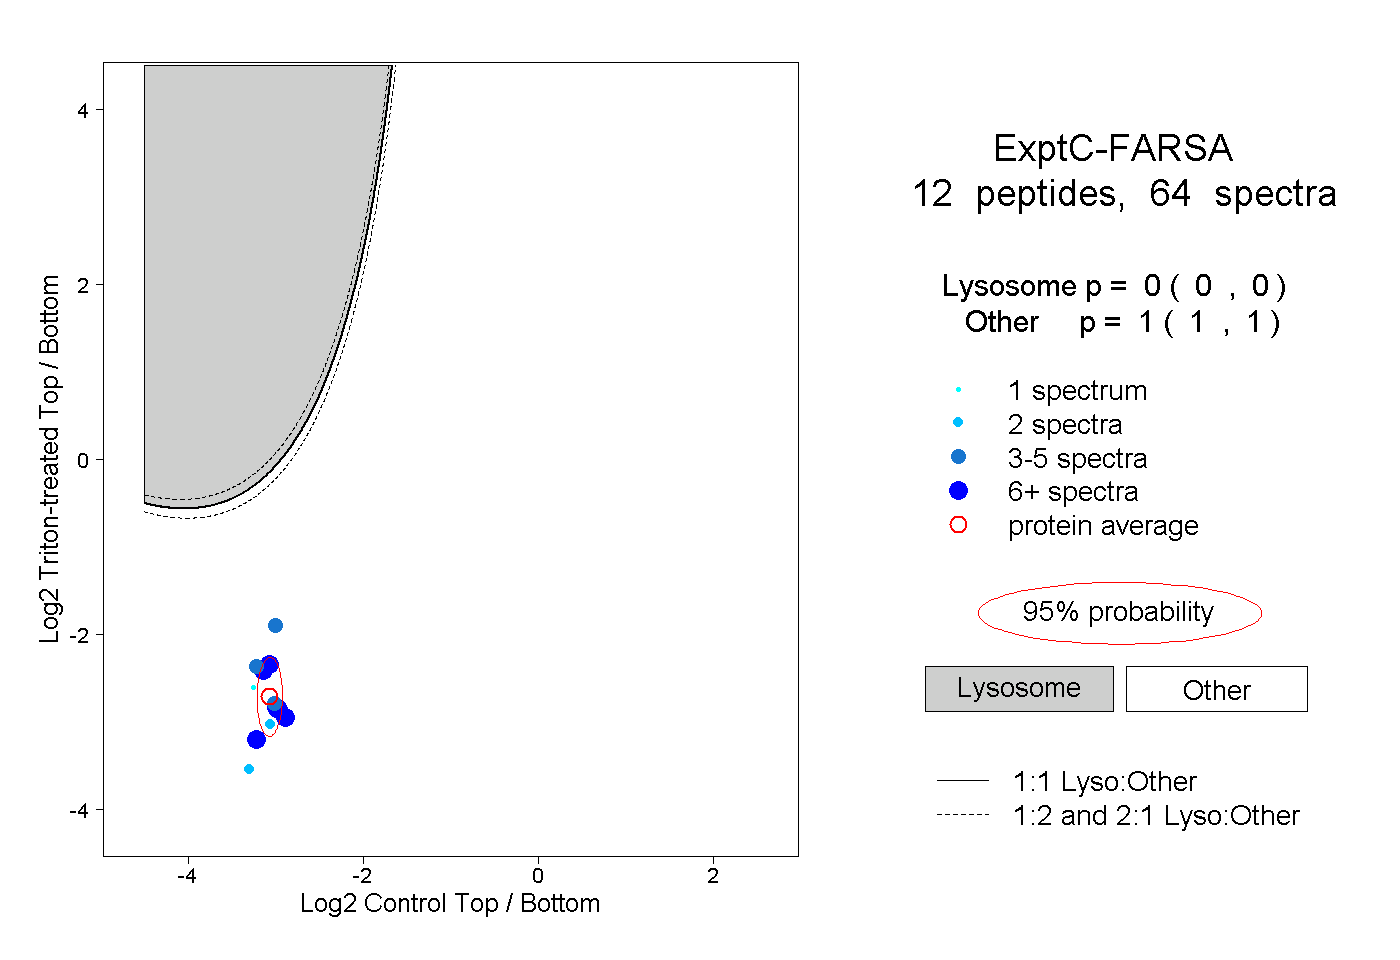
0.000 | 0.000
1.000 | 1.000
5peptides
spectra
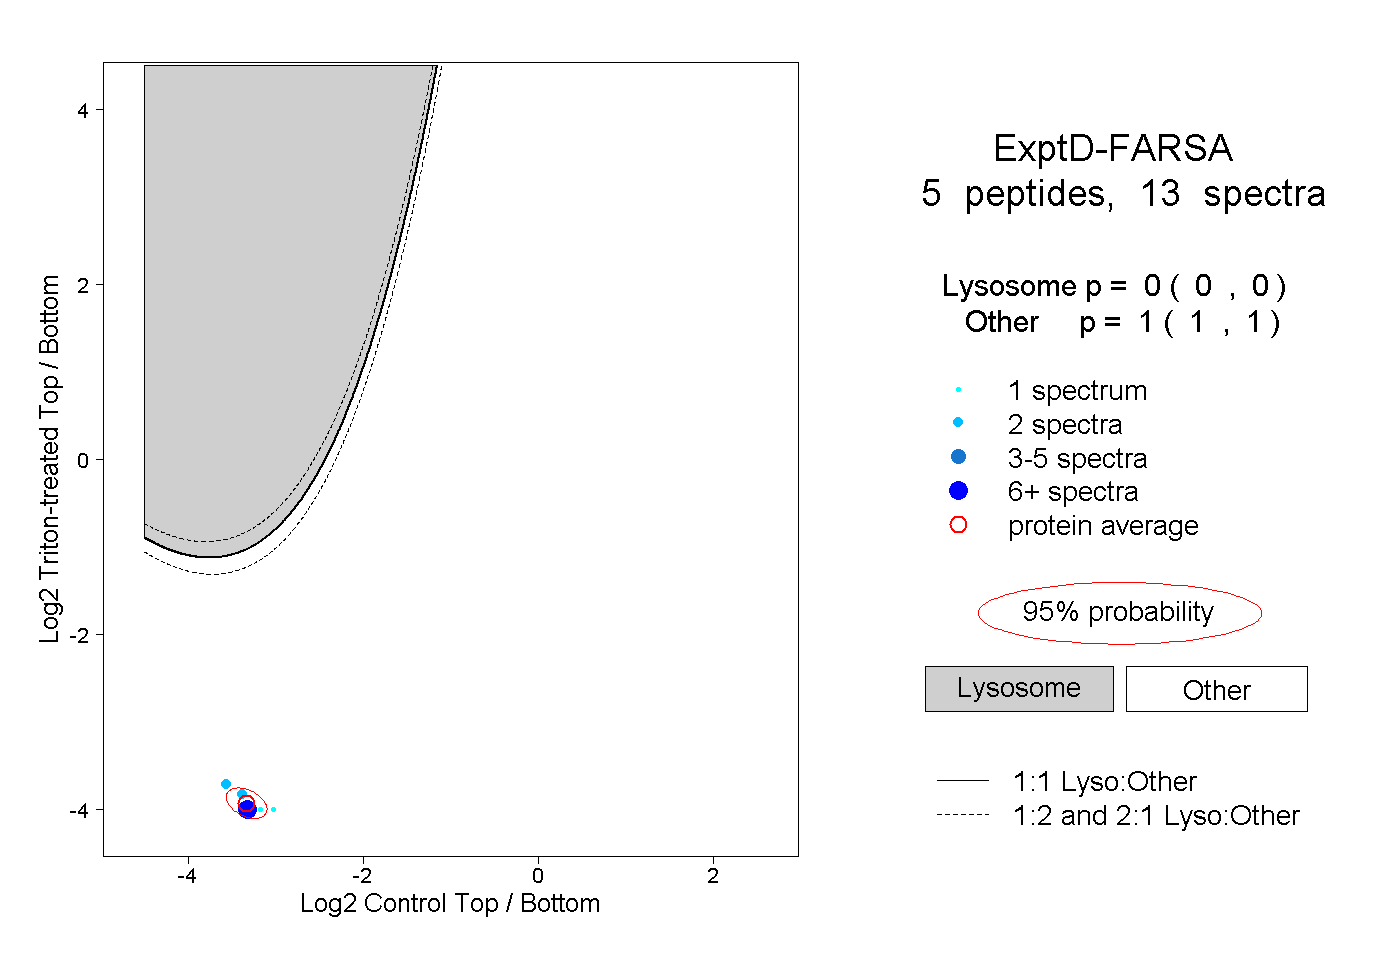
0.000 | 0.000
1.000 | 1.000