FARSA
[ENSRNOP00000004370]
Main page
| | | Plot |
Mito |
Lyso |
|
Perox |
ER |
Golgi |
PM |
Cytosol |
Nucleus |
|
| Expt A |
 16
16
peptides |
43
spectra |
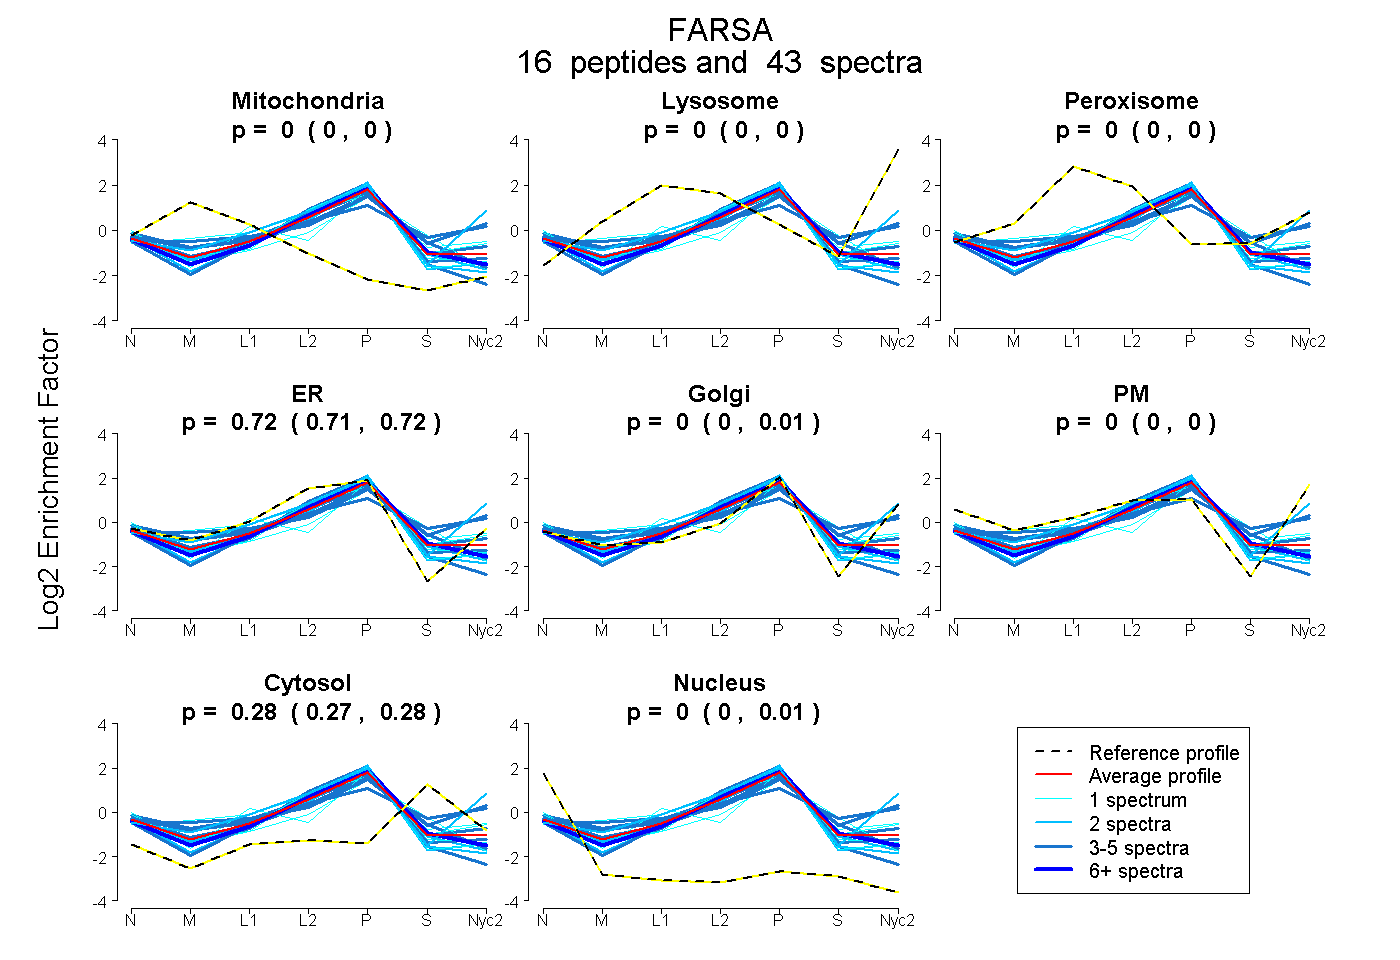 |
0.000
0.000 | 0.000 |
0.000
0.000 | 0.000 |
|
0.000
0.000 | 0.000 |
0.722
0.711 | 0.725 |
0.000
0.000 | 0.010 |
0.000
0.000 | 0.000 |
0.278
0.271 | 0.281 |
0.000
0.000 | 0.005 |
|
| | | Plot |
Mito |
|
Lyso or Perox |
|
ER |
Golgi |
PM |
Cytosol |
Nucleus |
|
| Expt B |
8
peptides |
23
spectra |
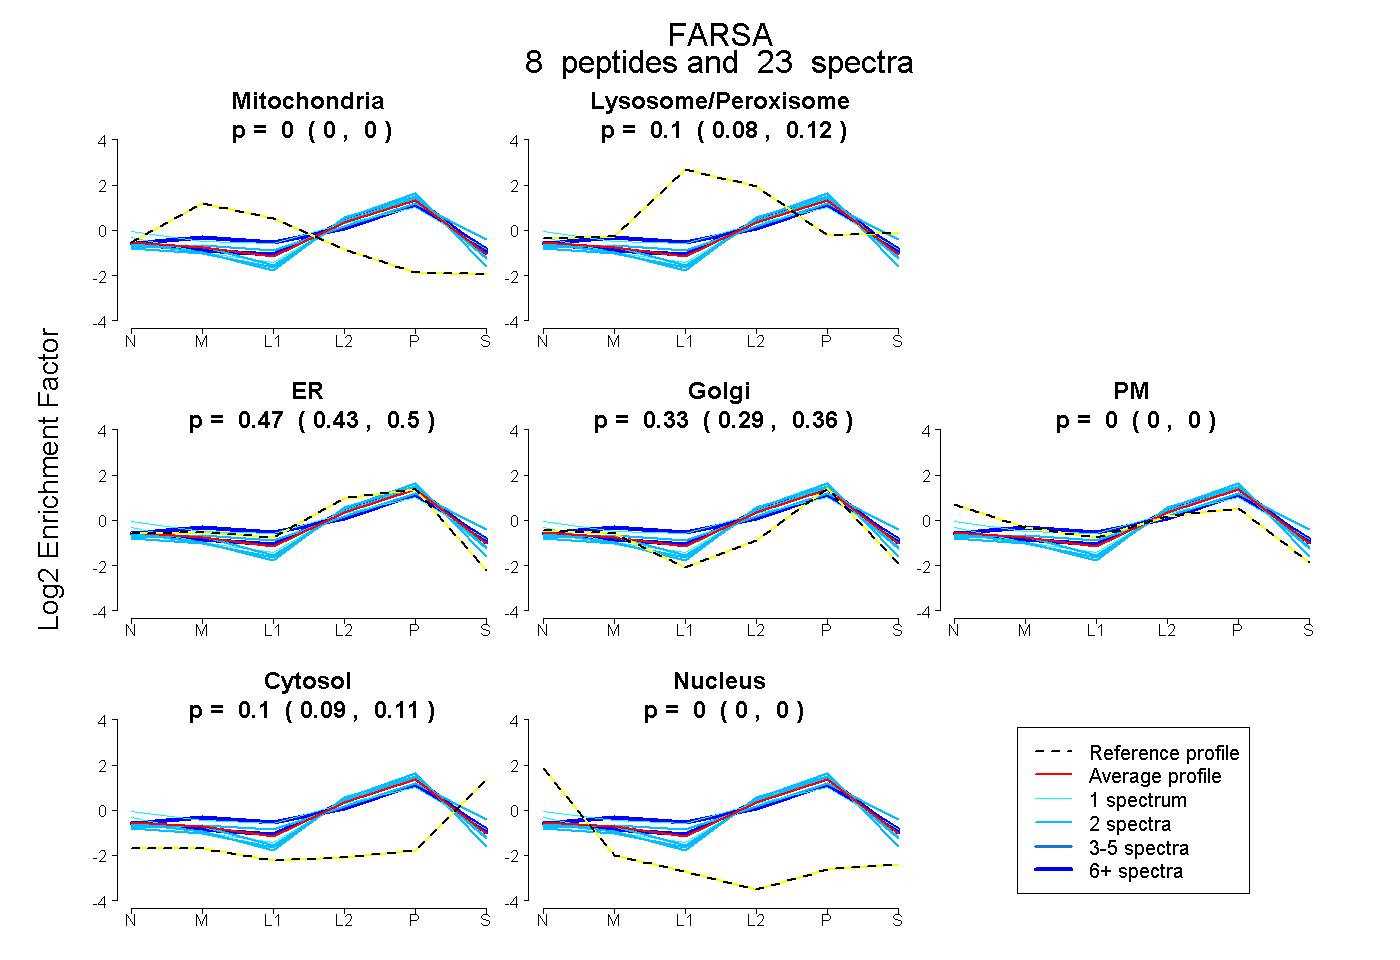 |
0.000
0.000 | 0.000 |
|
0.102
0.079 | 0.119 |
|
0.469
0.425 | 0.505 |
0.328
0.293 | 0.355 |
0.000
0.000 | 0.000 |
0.102
0.089 | 0.113 |
0.000
0.000 | 0.000 |
|
| 2 spectra, YFSIDR |
0.000 |
|
0.000 |
|
0.621 |
0.265 |
0.000 |
0.114 |
0.000 |
|
| 2 spectra, LDIEPR |
0.000 |
|
0.000 |
|
0.623 |
0.320 |
0.000 |
0.058 |
0.000 |
|
| 7 spectra, DRPFKPYNFSAR |
0.000 |
|
0.335 |
|
0.000 |
0.641 |
0.000 |
0.024 |
0.000 |
|
| 2 spectra, LQQVQAGQAEK |
0.000 |
|
0.235 |
|
0.195 |
0.425 |
0.000 |
0.146 |
0.000 |
|
| 6 spectra, ELVGHK |
0.000 |
|
0.097 |
|
0.516 |
0.268 |
0.000 |
0.118 |
0.000 |
|
| 2 spectra, LLTEVILK |
0.000 |
|
0.000 |
|
0.609 |
0.279 |
0.000 |
0.112 |
0.000 |
|
| 1 spectrum, YGINNIR |
0.000 |
|
0.316 |
|
0.000 |
0.535 |
0.130 |
0.019 |
0.000 |
|
| 1 spectrum, KPFTPAK |
0.000 |
|
0.000 |
|
0.642 |
0.251 |
0.001 |
0.106 |
0.000 |
|
| | | Plot |
|
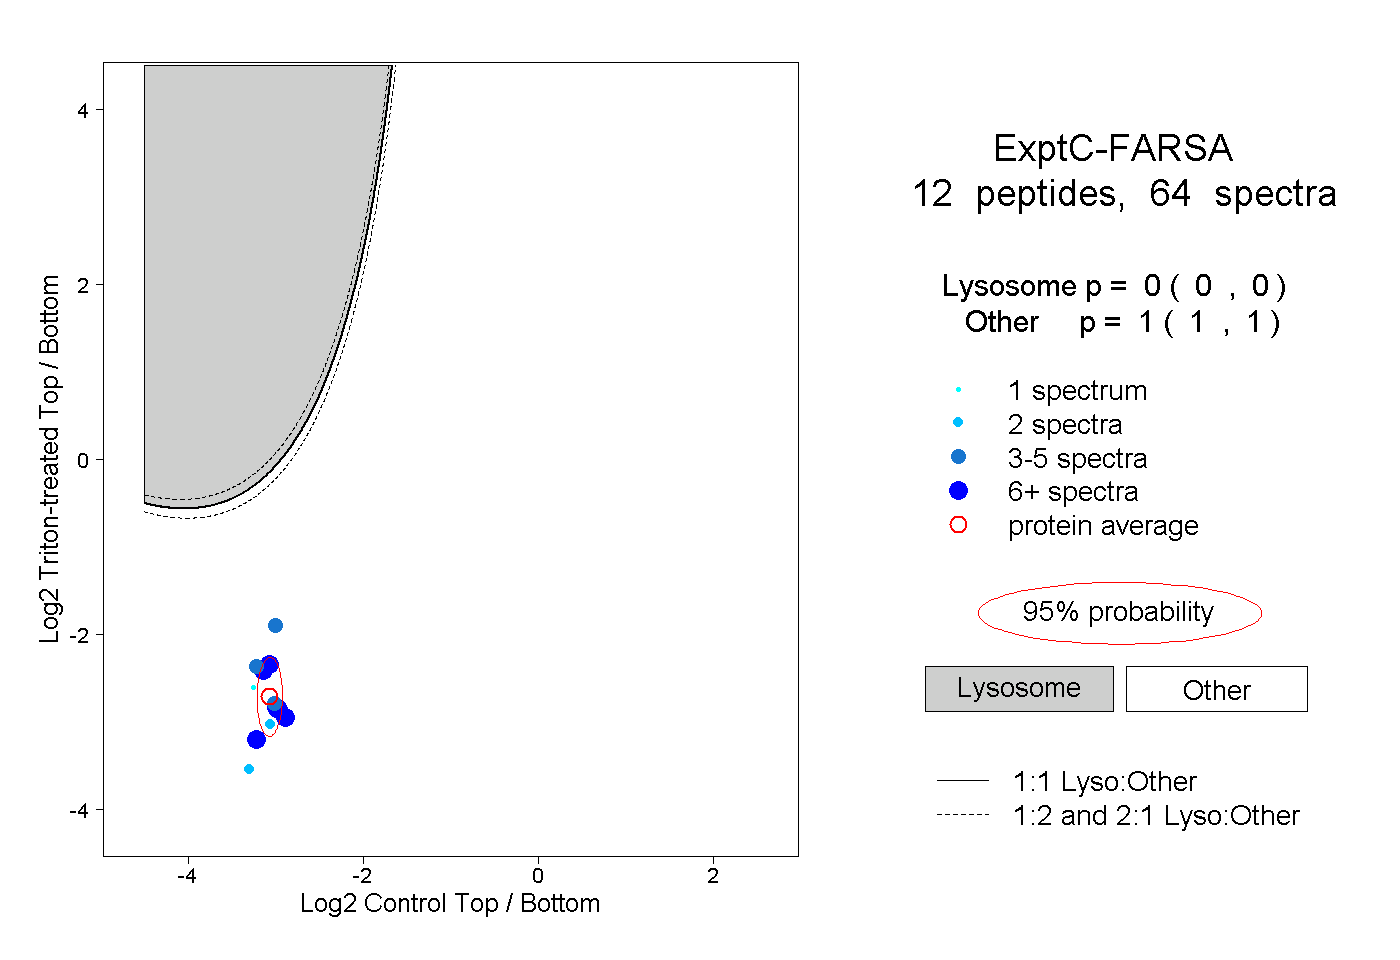
Lyso |
|
|
|
|
|
|
|
Other |
| Expt C |
12
peptides |
64
spectra |
 |
|
0.000
0.000 | 0.000 |
|
|
|
|
|
|
|
1.000
1.000 | 1.000 |
| | | Plot |
|
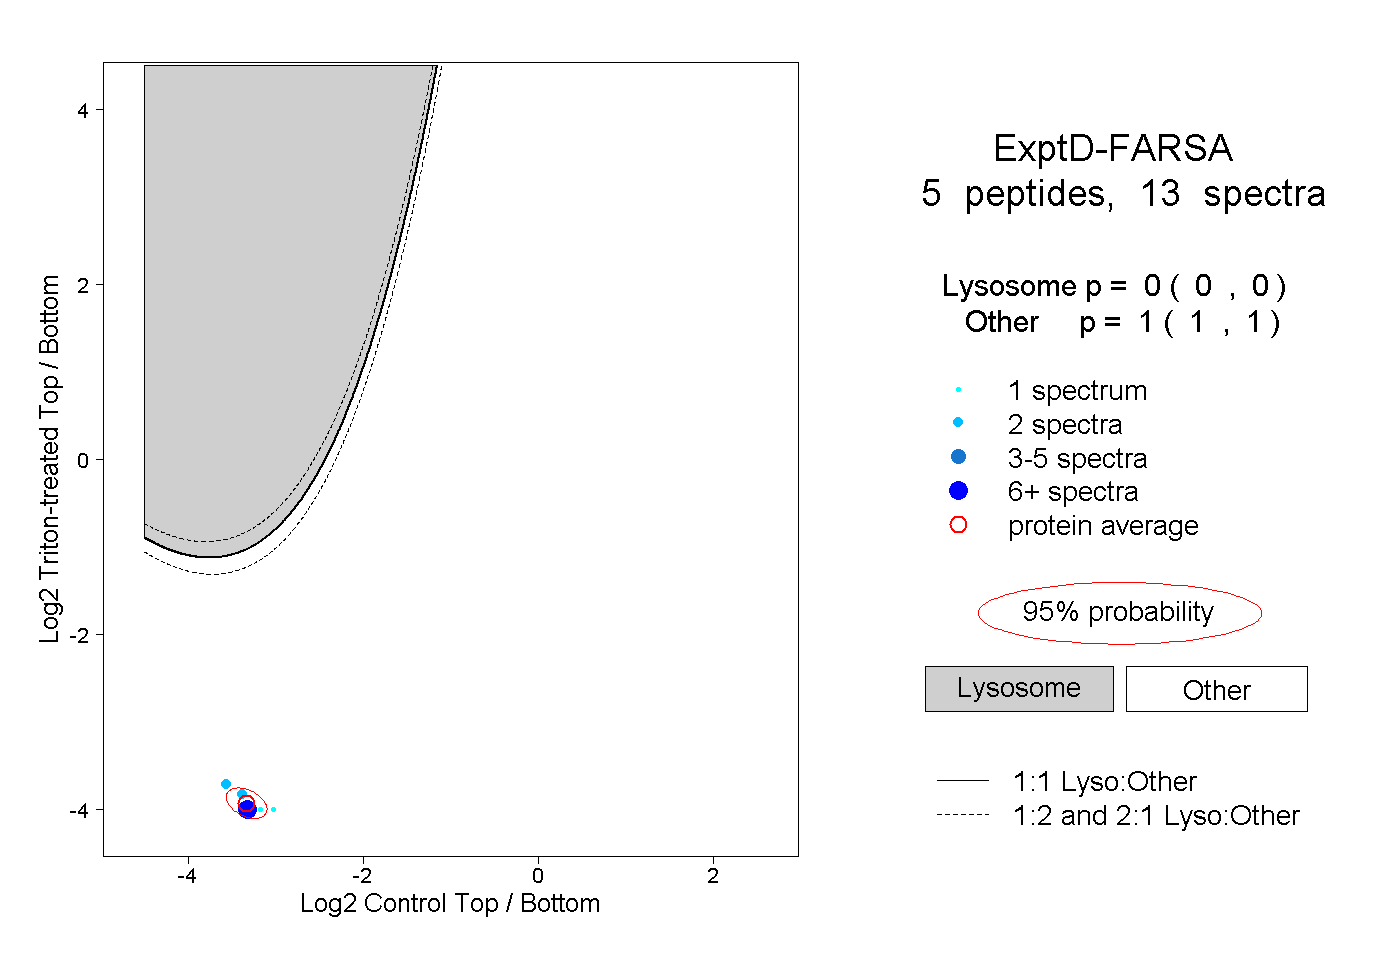
Lyso |
|
|
|
|
|
|
|
Other |
| Expt D |
5
peptides |
13
spectra |
 |
|
0.000
0.000 | 0.000 |
|
|
|
|
|
|
|
1.000
1.000 | 1.000 |