 3
3peptides
spectra
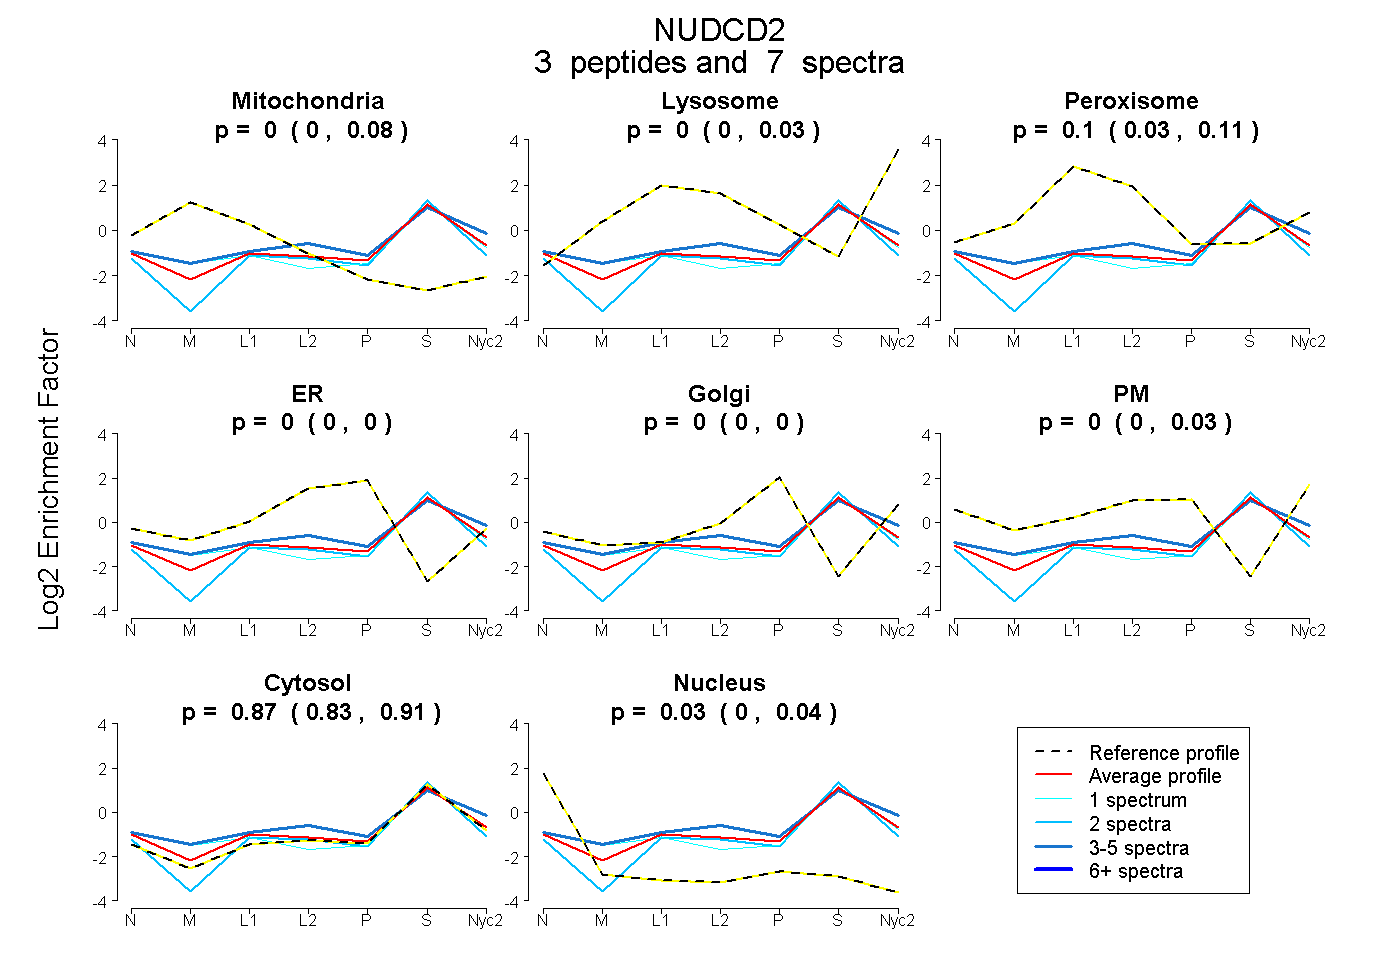
0.000 | 0.076
0.000 | 0.031
0.025 | 0.112
0.000 | 0.000
0.000 | 0.000
0.000 | 0.034
0.830 | 0.912
0.000 | 0.037
1peptide
spectrum
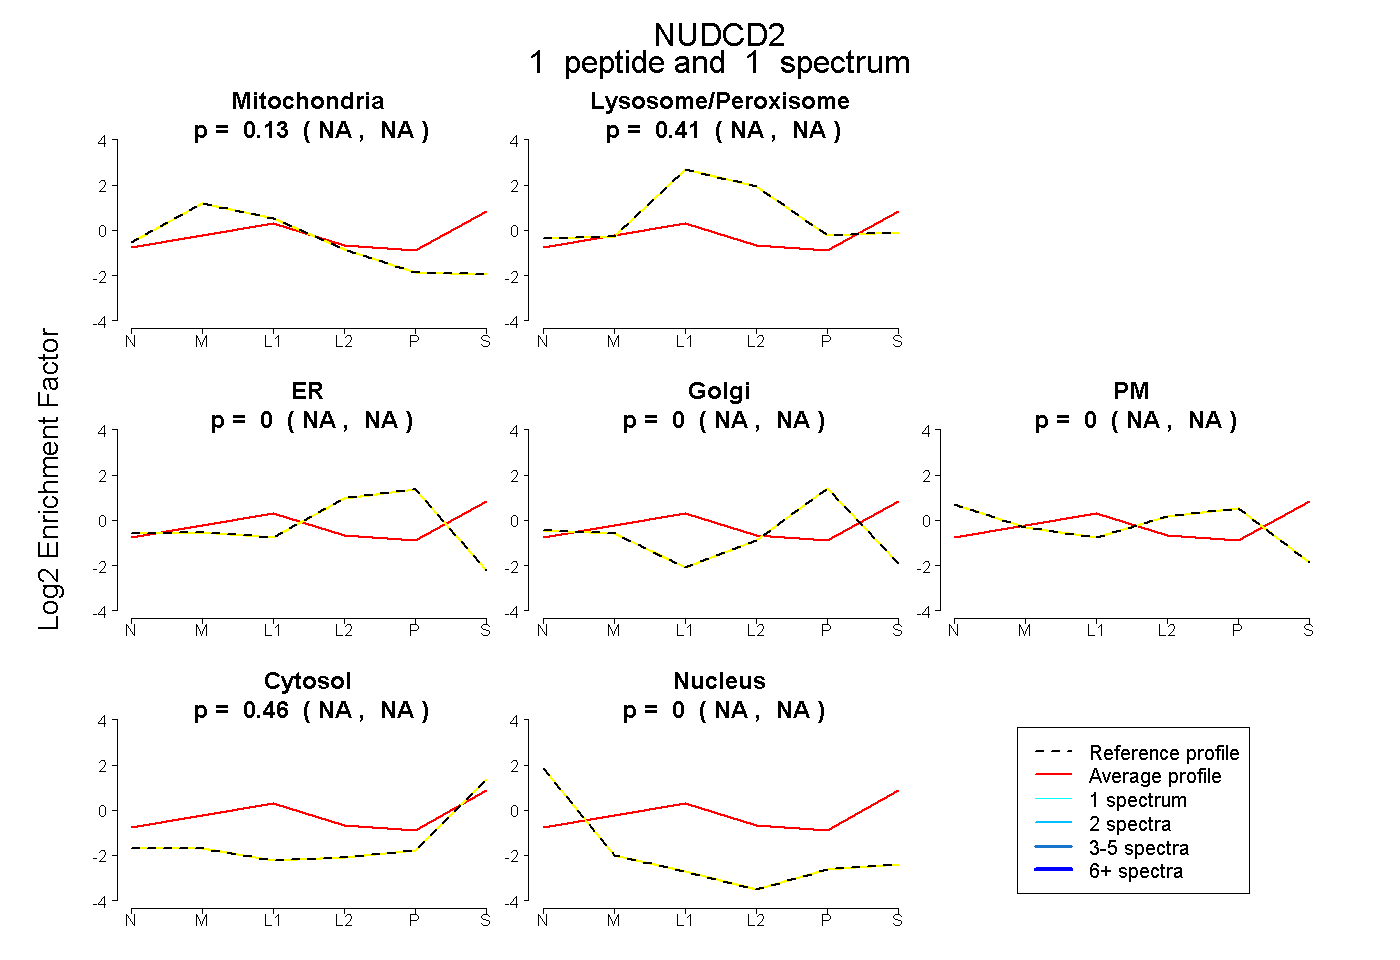
NA | NA
NA | NA
NA | NA
NA | NA
NA | NA
NA | NA
NA | NA
2peptides
spectra
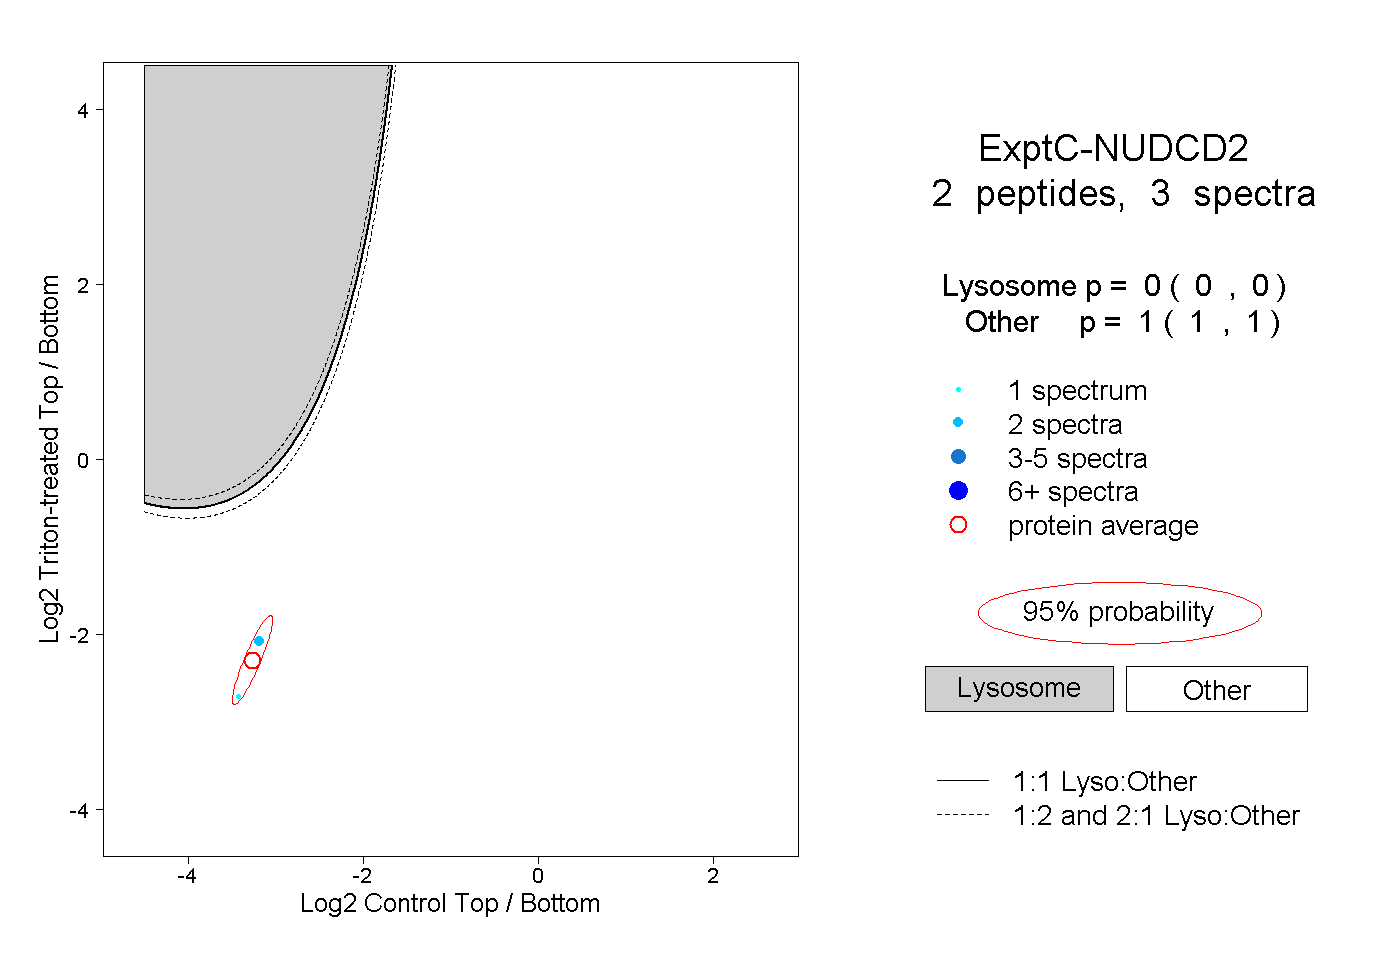
0.000 | 0.000
1.000 | 1.000