 3
3peptides
spectra
0.000 | 0.076
0.000 | 0.031
0.025 | 0.112
0.000 | 0.000
0.000 | 0.000
0.000 | 0.034
0.830 | 0.912
0.000 | 0.037
| Plot | Mito | Lyso | Perox | ER | Golgi | PM | Cytosol | Nucleus | |||||
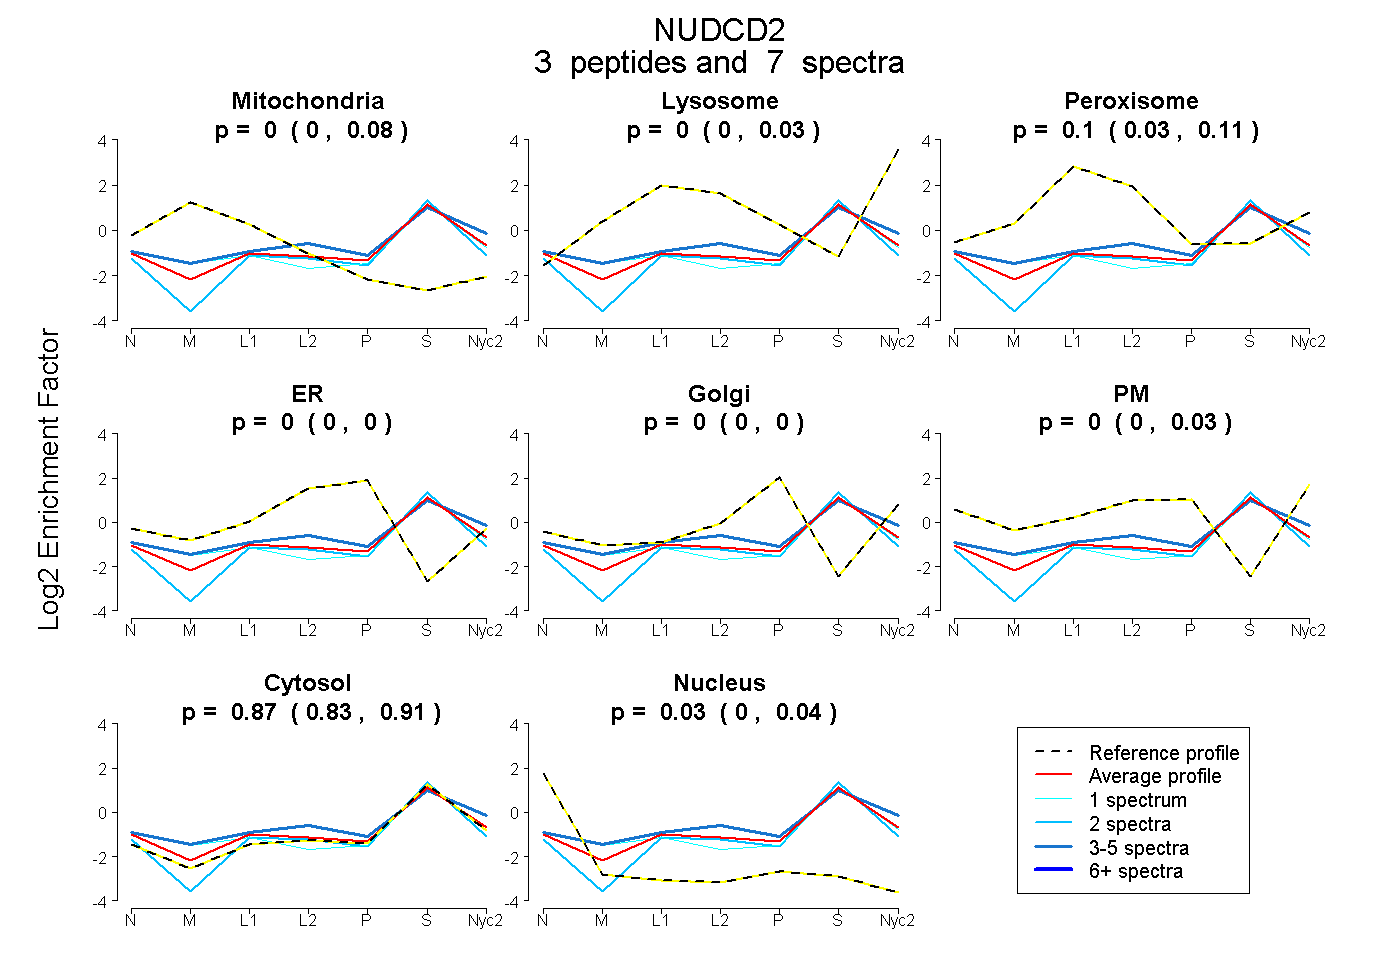
| Expt A |
3 peptides |
7 spectra |
|
0.000 0.000 | 0.076 |
0.000 0.000 | 0.031 |
0.101 0.025 | 0.112 |
0.000 0.000 | 0.000 |
0.000 0.000 | 0.000 |
0.000 0.000 | 0.034 |
0.872 0.830 | 0.912 |
0.026 0.000 | 0.037 |
| 1 spectrum, GGPDFSNLEK | 0.149 | 0.006 | 0.000 | 0.000 | 0.000 | 0.000 | 0.846 | 0.000 | ||
| 4 spectra, HVALAVGGR | 0.016 | 0.064 | 0.099 | 0.000 | 0.000 | 0.062 | 0.758 | 0.000 | ||
| 2 spectra, AQDIQCGLQSR | 0.000 | 0.000 | 0.000 | 0.000 | 0.000 | 0.000 | 0.978 | 0.022 |
| Plot | Mito | Lyso or Perox | ER | Golgi | PM | Cytosol | Nucleus | ||||||
| Expt B |
1 peptide |
1 spectrum |
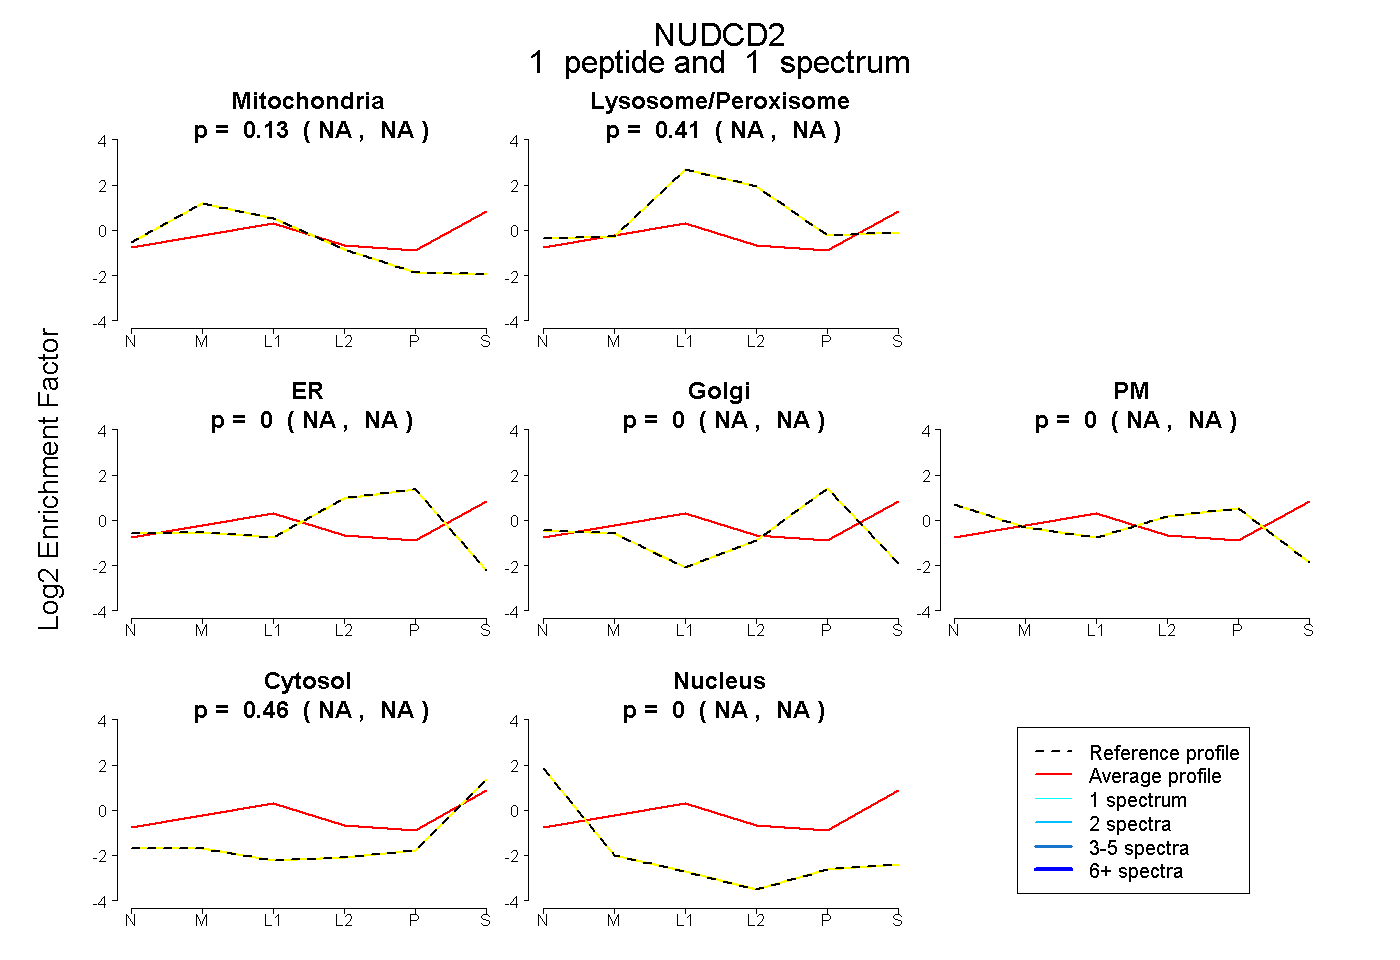 |
0.130 NA | NA |
0.407 NA | NA |
0.000 NA | NA |
0.000 NA | NA |
0.000 NA | NA |
0.462 NA | NA |
0.000 NA | NA |
|||
| Plot | Lyso | Other | |||||||||||
| Expt C |
2 peptides |
3 spectra |
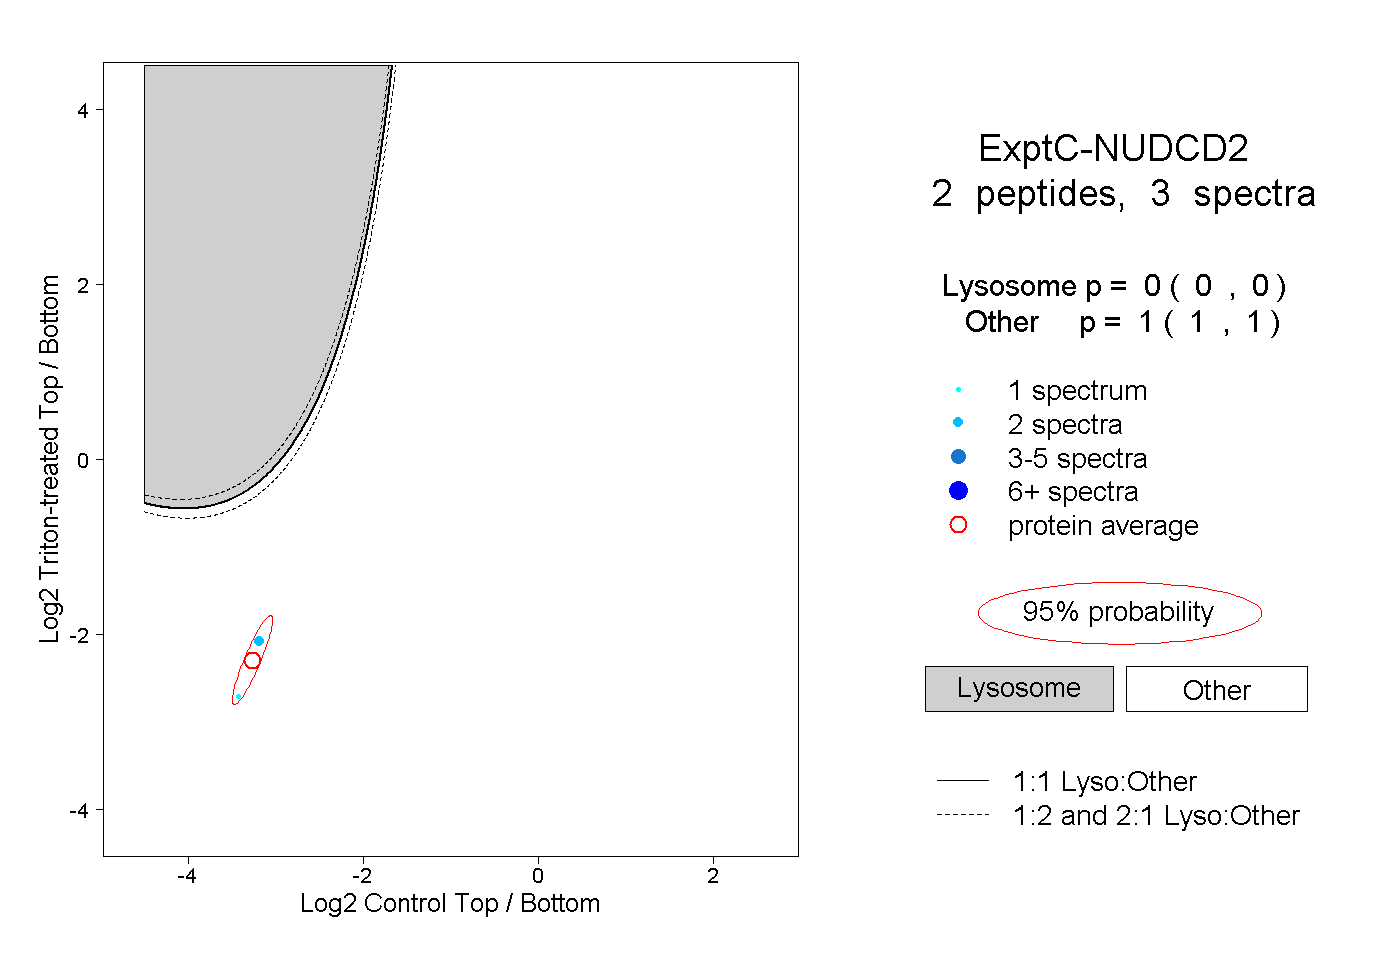 |
0.000 0.000 | 0.000 |
1.000 1.000 | 1.000 |