 10
10peptides
spectra
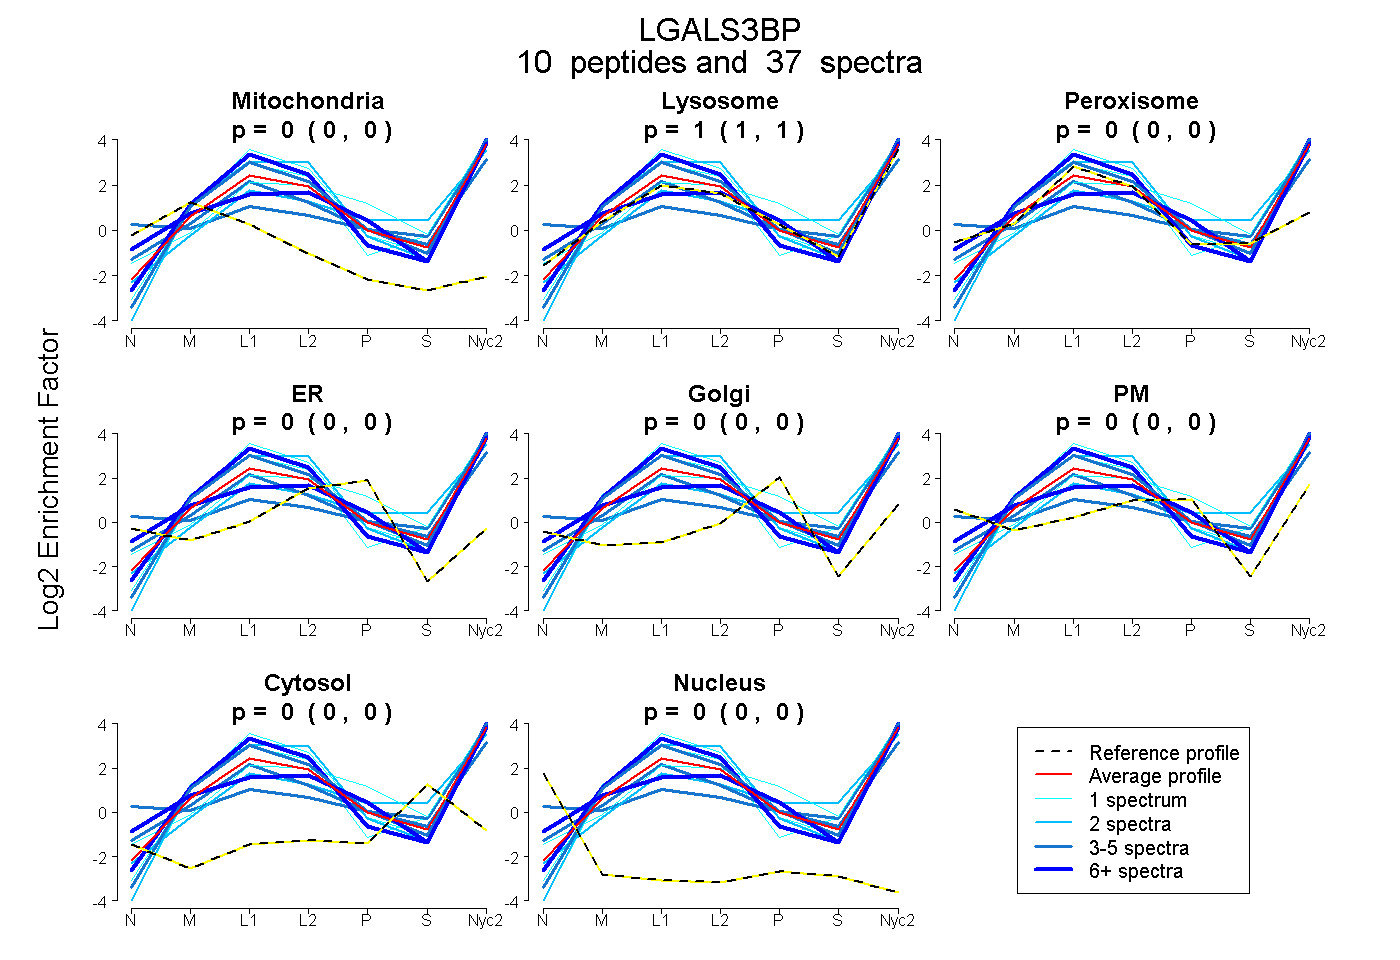
0.000 | 0.000
1.000 | 1.000
0.000 | 0.000
0.000 | 0.000
0.000 | 0.000
0.000 | 0.000
0.000 | 0.000
0.000 | 0.000
5peptides
spectra
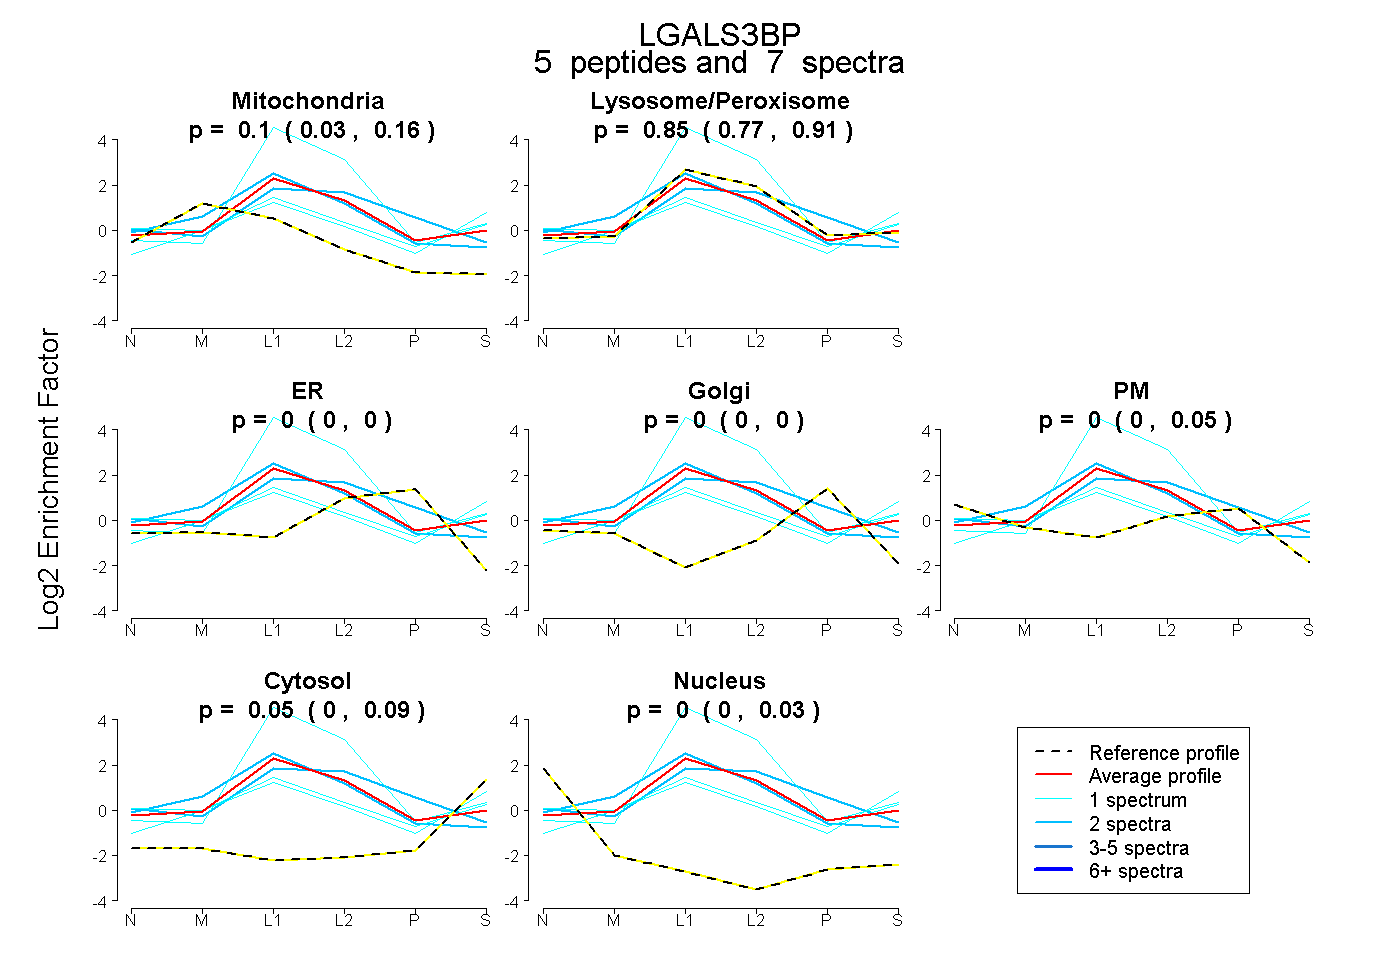
0.033 | 0.155
0.767 | 0.908
0.000 | 0.000
0.000 | 0.000
0.000 | 0.049
0.000 | 0.087
0.000 | 0.027
15peptides
spectra
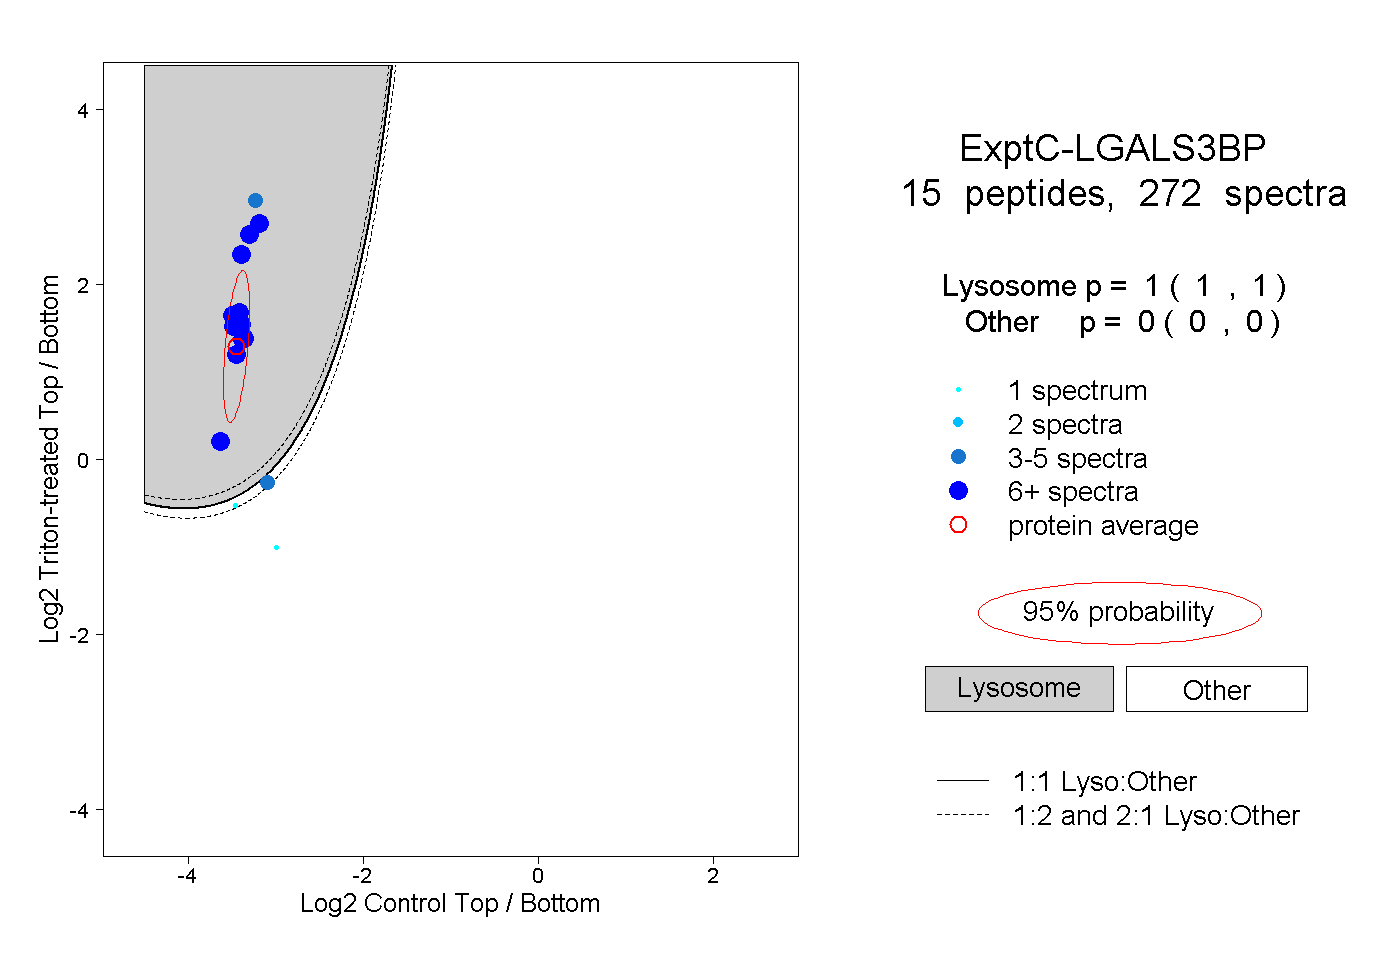
1.000 | 1.000
0.000 | 0.000
6peptides
spectra
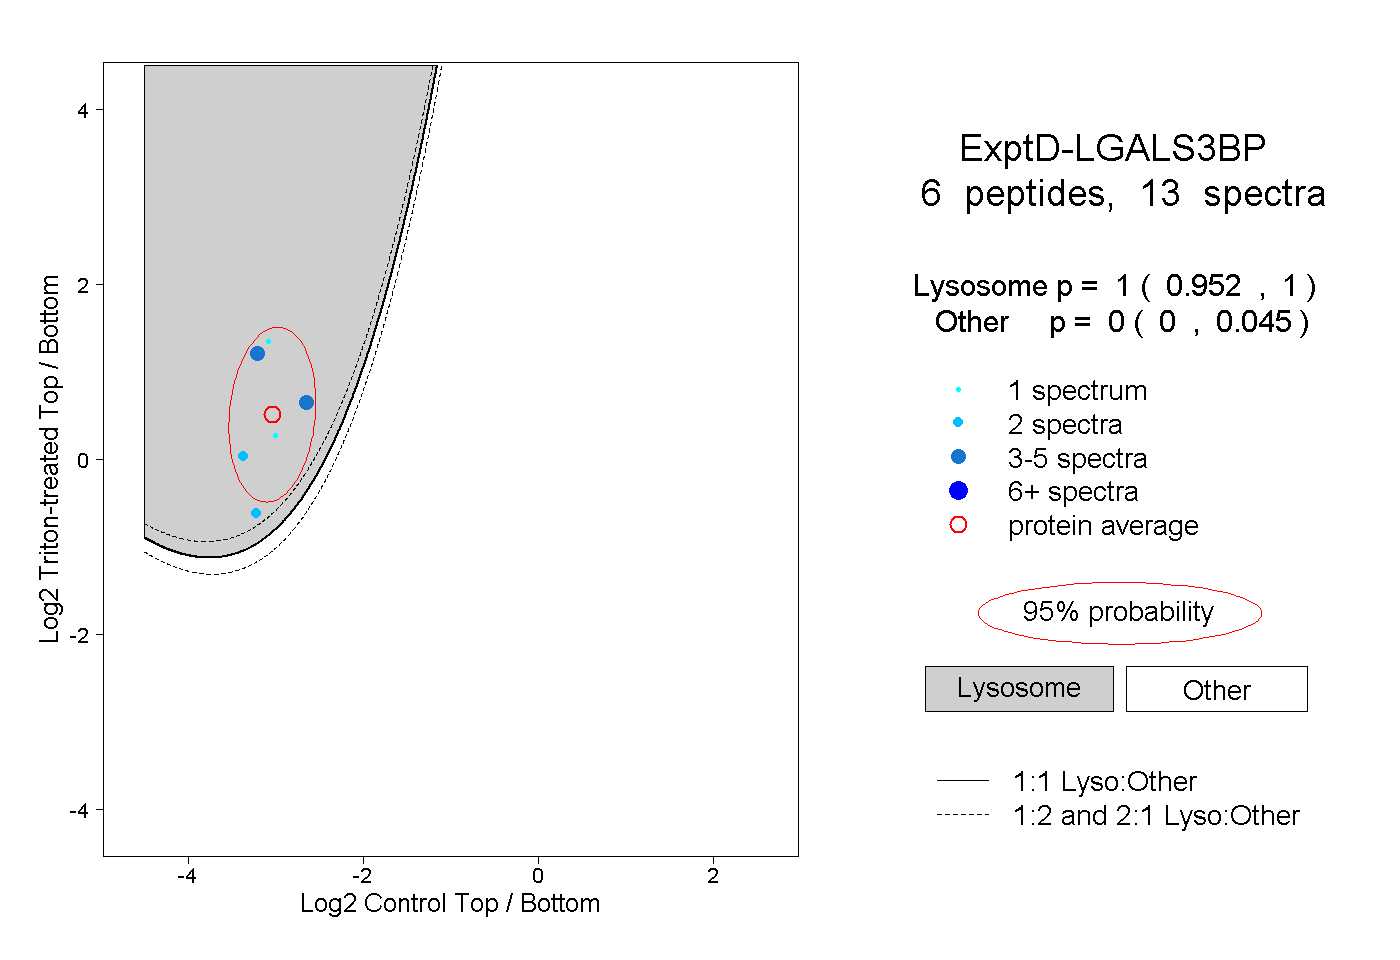
0.952 | 1.000
0.000 | 0.045